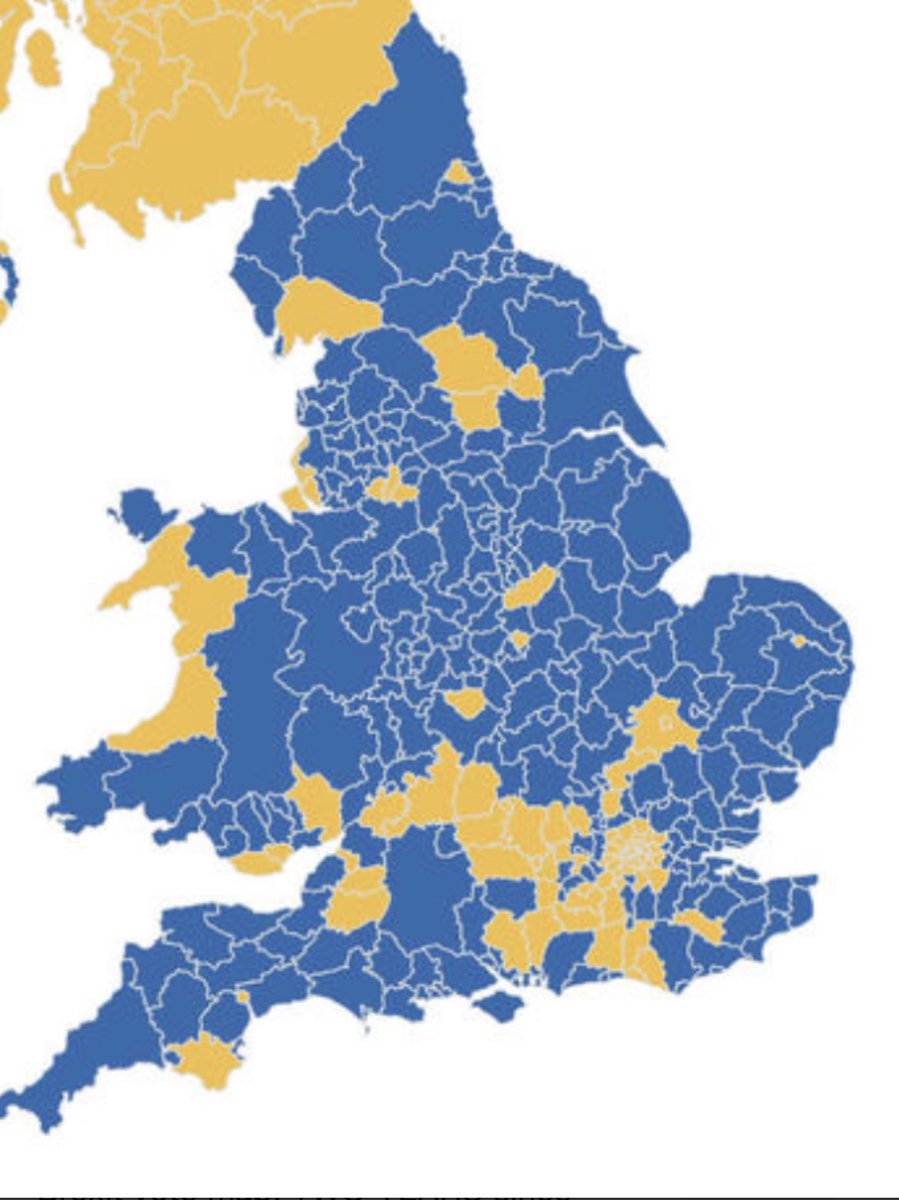
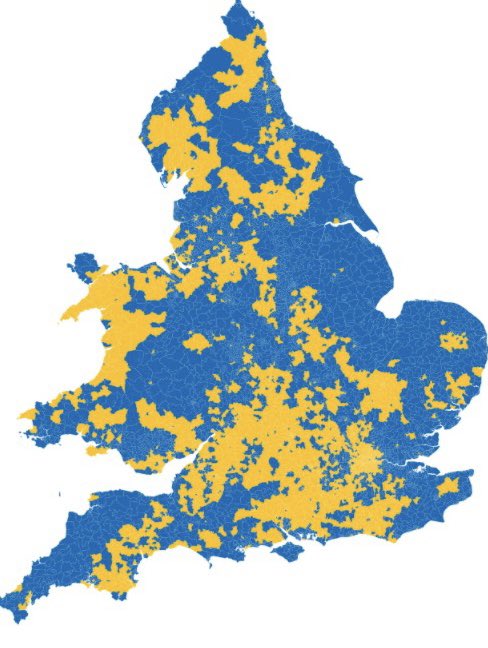
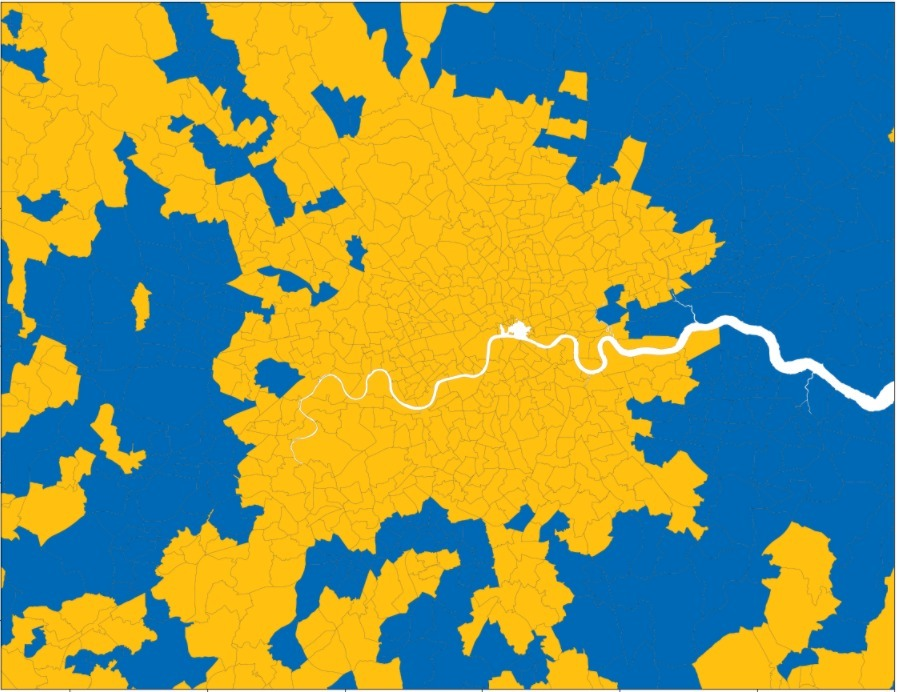
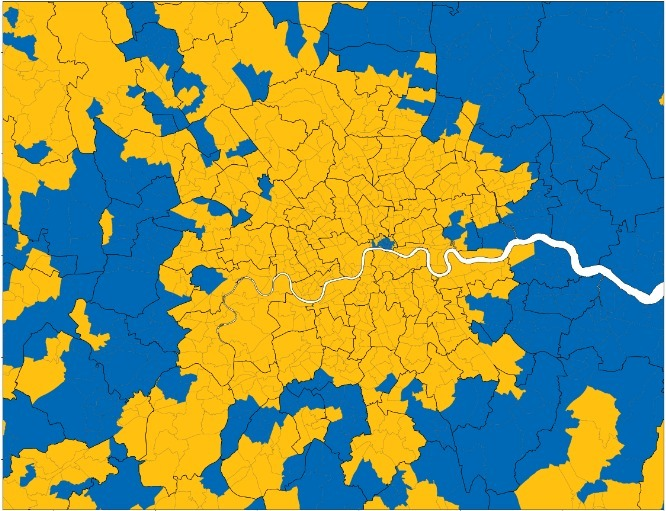
We’ve ( @HanburyStrategy) calculated ward level EU Referendum estimates in England/Wales. Mapping 1000+ real results and 7000+ modelled ones. The picture by ward (RHS) shows a much more complex picture than local authority results (LHS) of Leave rural areas vs Remain cities. (1/3)
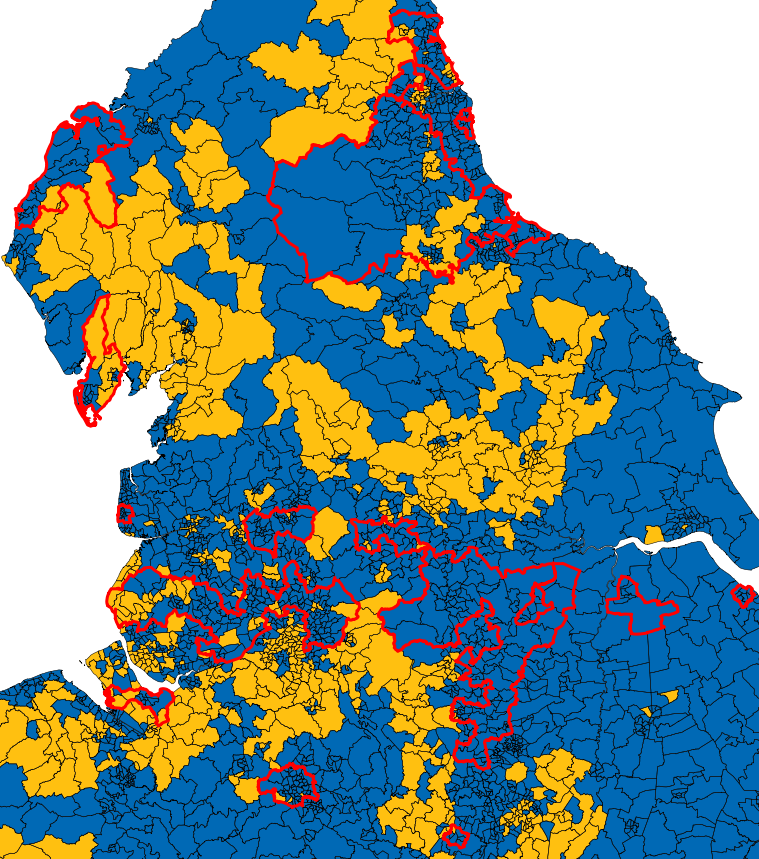
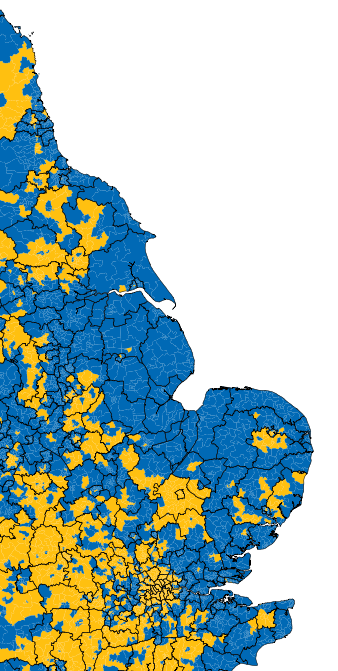
We can see that 200 seat Wessex is highly contested on this axis. The degree of leave dominance across the East coast is utterly remarkable. The red wall is also much more divided then a blanket leave vote, and the eradication of the liberals in West Country explained (2/3)
Hope to provide similar analysis of Scotland and NI soon - but interesting to note that on a 53/47 leave/remain leave takes c.70% of wards!
I’ll be uploading full model details sometime soon (hierarchical linear regression) and estimates soon. Model power was R2 of 85% and standard error of 3%. Much trickier to model turnout (and iteratively rake to match known levels of turnout) rather than leave/remain (Postscript)
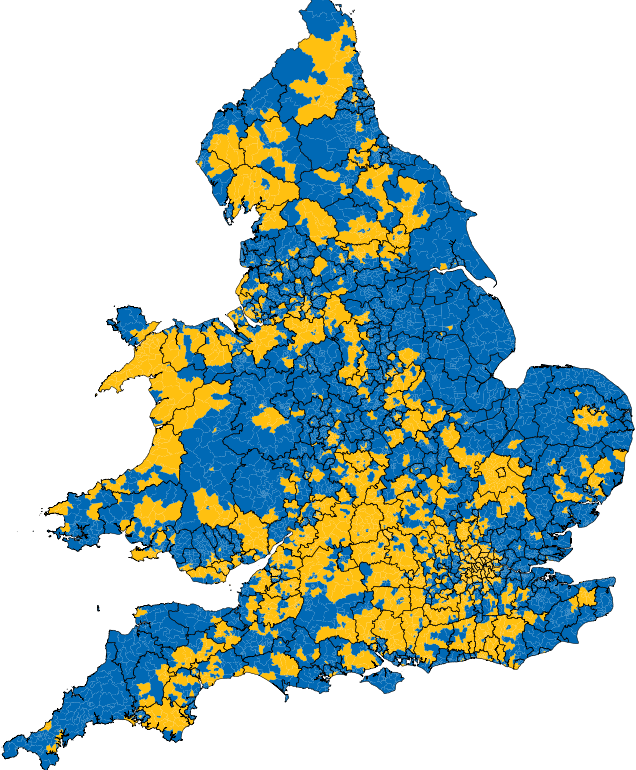
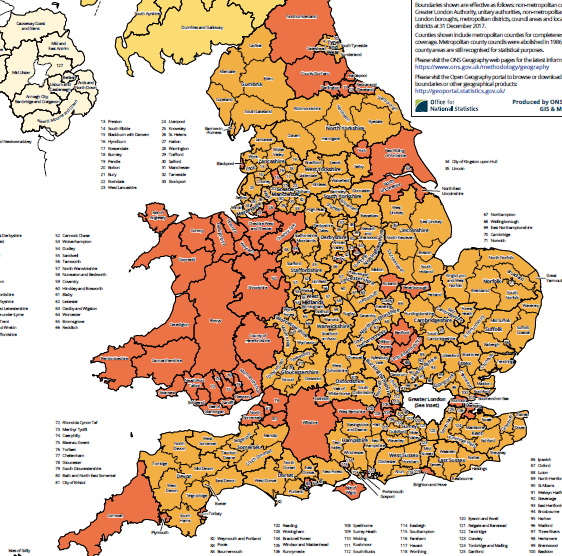
Inserting Local Authority lines back onto the map - you can start to get a sense of the complexity in voting patterns. Some authorities vote as one, but others - particularly in N Yorkshire, Northumberland, Cumbria, Powys, Devon, Wiltshire are very split
The Remain voters emanate out of London basically by Train spokes. Commuting, and place of work, are almost as predictive as actual physical polling locations. London is literally two cities - 2/3 inner entirely Remain, 1/3 Leave
What's really interesting is the western (but not Eastern) tilt of Remain voters out of London. Take a train from Devon to London and you make it through highly affluent, divided communities. The geographic heart of Remain is is just as David Cameron's Oxfordshire as it is London
The Red Wall pockets map neatly across discrete pockets of the North and East Midlands which basically are "quite" a bit more urban than the average Tory held wards and very Leavey. The close vote in Leeds/Sheffield/Birmingham is a function of city size + surrounding countryside
I'm from the Kentish East Coast and I find the sheer concentration, dominance and scale of Leave voting without parallel in England. The West coast has structurally a different culture to the East and this isn't discussed enough without descending into Danelaw/Viking territory
Thanks to @HanburyStrategy's Aaron Iftikhar who mapped my modelling. Stellar work and some interesting food for thought. Next mapping up will be the intersection of 2019 GE vs 2016 EU Ref and 2017 GE vs 2016 EU Ref. Stay tuned. Some estimates may change as they are refined.

 Read on Twitter