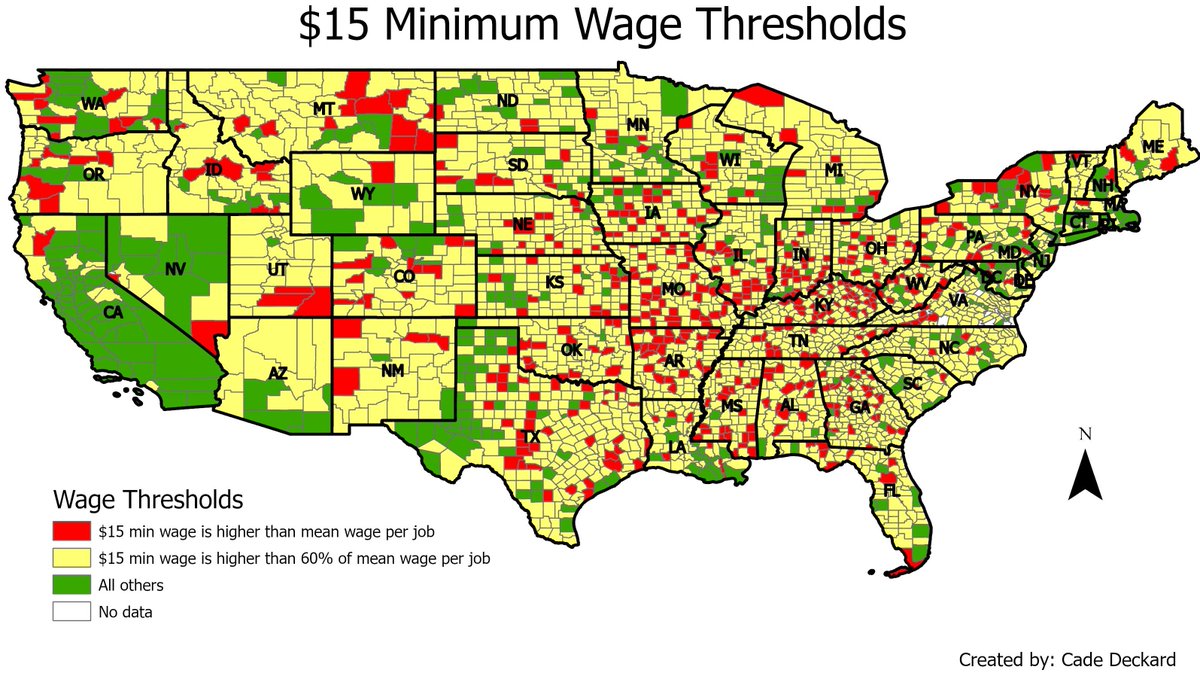
1/n My modest contribution to the #econtwitter minimum wage discussion. I wanted to see where potential employment effects might occur, and used the 60% threshold that @arindube QJE, 2019 paper suggests.
So this is a map of the average wage per job at the county level.
So this is a map of the average wage per job at the county level.
2/n This is tricky to unpack. Some rural places affected, but also many are not. Large, sparsely populated agricultural centers (west Texas, CA) seem to have much higher average (mean) wages.
3/n Of course, the mean wage will be higher than the median wage, so this understates the issue. And, these are 2019 data, not mid-2020's when the proposed $15 min wage would be in effect. Still, the geographic variability is unlikely to change enormously.
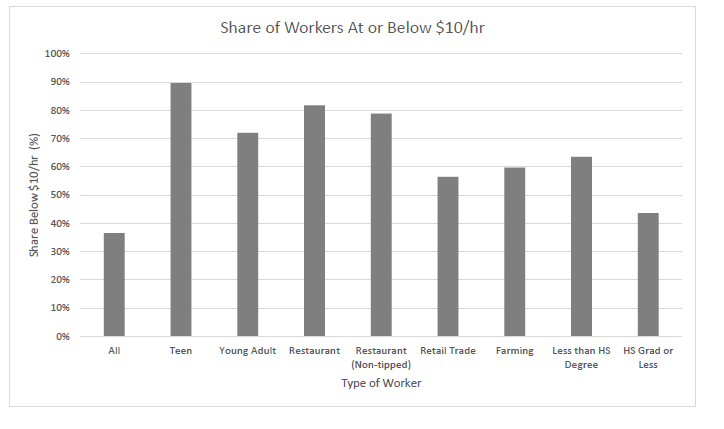
4/n The really fabulous contribution my @NeumarkDN and Peter Shirley gives us some nice snapshots into the demographics of those most likely affected. These are the workers who are recently employed at < $10 an hour.
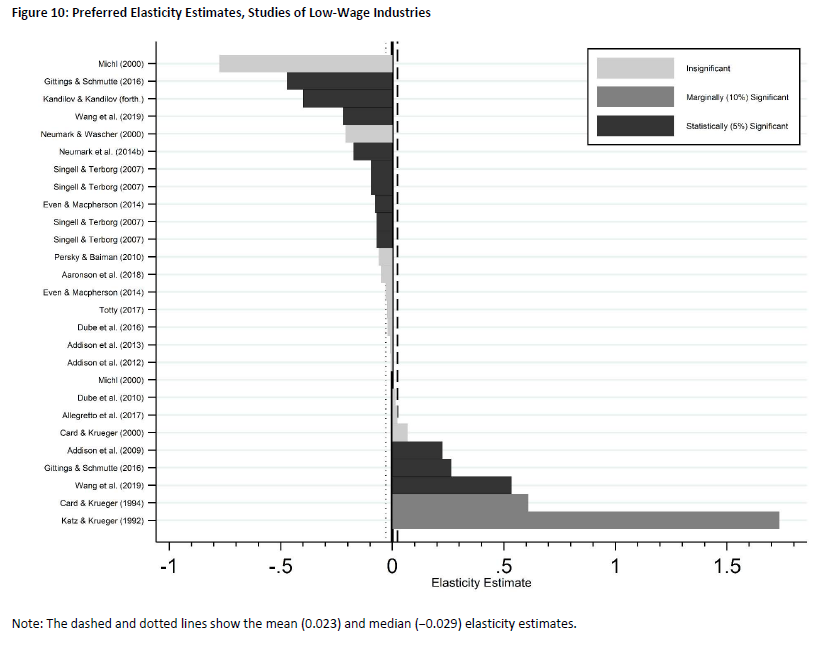
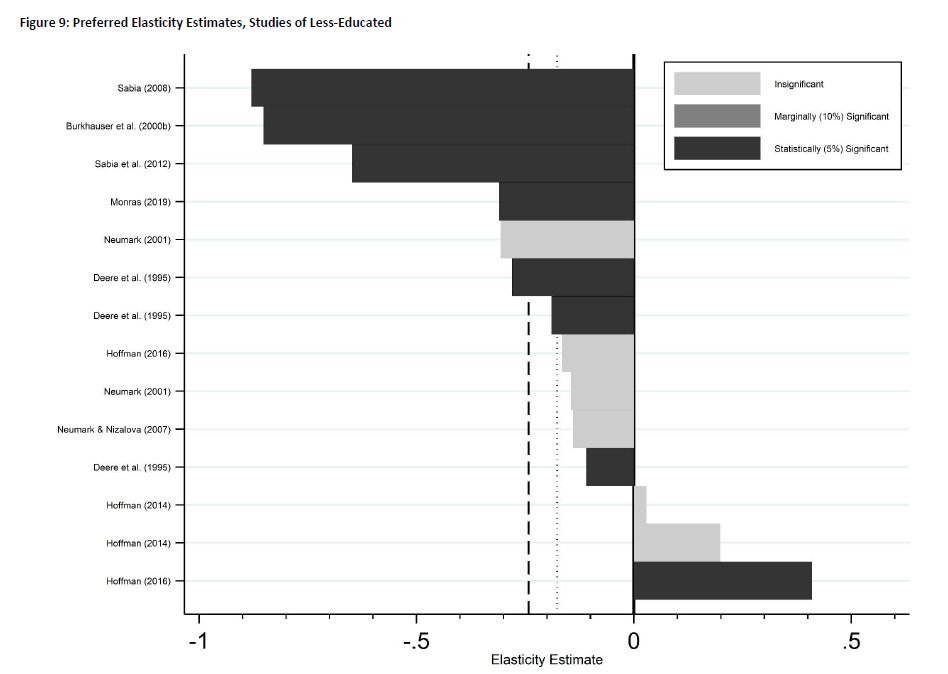
7/n I've become ambivalent about the minimum wage. It's political efficiency is far greater than its economic efficiency in improving the lot of low wage workers. That's too bad, since it tends to stifle a more adult conversation about better policies for low wage workers.

 Read on Twitter


