I am excited to share our new WP with @jmontalbancas and @FelixWeinhardt: “Home Broadband and Human Capital Formation”. This is a WP from @CESifoGroup
Find the paper here:
https://www.cesifo.org/en/publikationen/2021/working-paper/home-broadband-and-human-capital-formation
Let me tell you about it (1/20) \\begin
Find the paper here:
https://www.cesifo.org/en/publikationen/2021/working-paper/home-broadband-and-human-capital-formation
Let me tell you about it (1/20) \\begin
We study the impact of broadband speed on standarised test scores. The educational technology industry is booming. However, “researchers and educators are far from a consensus on what types of EdTech are most worth investing in and in which contexts” (Escueta et al., 2017)
Because online learning is likely to remain a key input in education, identifying whether high-speed (broadband) internet impacts student educational outcomes has important economic and policy implications. This is crucial in the advent of temporary shocks, e.g. COVID-19.
Two things determine home broadband speeds: where we live and what we subscribe to. Two major identification challenges:
(1) Active selection: household observed internet package choices are non-random and correlate with socioeconomics which influence education outcomes.
(1) Active selection: household observed internet package choices are non-random and correlate with socioeconomics which influence education outcomes.
Instead, we can exploit local available broadband speeds, which depend on the location of the home with respect to the broadband infrastructure network. However, we face (2), passive selection: a stark correlation between local geography and local available internet speed exists.
To overcome these issues, in the design of our strategy we use a well-known feature of broadband internet technology: the length of the copper wire that connects residences to the telephone local exchange (LE) station is a key determinant of local available broadband speeds.
Each home is connected to one local telephone exchange. LE stations provide telephone and broadband services via copper cable. As the distance at which the household is located with respect to LE determines cable length, we use this distance as our treatment.
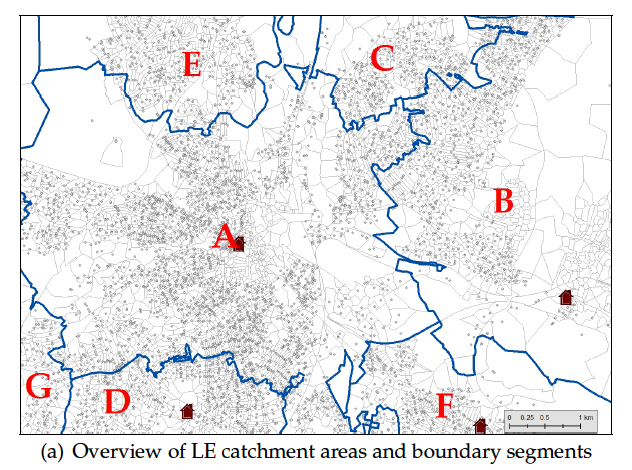
We note that each LE station has an invisible catchment area (CA) of residential addresses that it serves in its surroundings. The extent and shape of this CA is a byproduct of history that led to invisible, irregular and essentially randomly placed station-level CA boundaries.
The LE stations are not necessarily placed in the centre or denser part of the differently sized CA. Thus, stations can be located at many different distances from the boundaries. Importantly, their location is not random and correlates with lots of underlying local geography.
We focus on households whose residences are in the close vicinity of these invisible CA boundaries, exploiting variation in distances to the connected station across small boundary segments, each side connected to a different LE station.
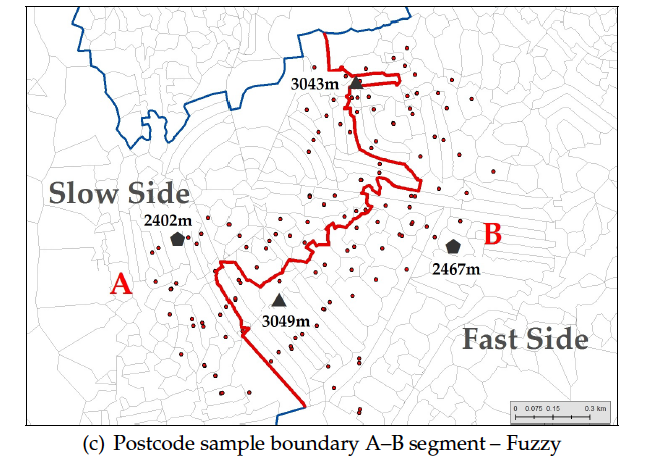
We draw the CA boundaries and split in small segments. We calculate the average distance to LE of the addresses at each side of a segment and classify it as fast side (closest) or slow side (farthest). We use data on pupils how live very close to the segments.
Identification: We exploit a (fuzzy) spatial regression discontinuity (SRD) design. We compare “lucky” households that are supplied with faster broadband access to otherwise similar counterparts that were “unlucky”, supplied with slower broadband access
The discontinuity is fuzzy because, even when the average distance on one side is shorter (fast), some households can be further from the LE than others in the other side (slow. If we do not account for this, the coefficients are biased towards zero. See the example below.
Data: administrative data on standardized test scores for 14-year-old (2005-2008) in England (NPD). In addition, we use comprehensive information on the telecom network, administrative student records, school characteristics, local house prices and local amenities.
Our main finding is that broadband quality has positive effects on national externally marked test scores. We find that moving 100 meters closer to the LE station increases student test scores by 0.122 percentile ranks.
In order to disentangle the parameter of interest, we use additional data to estimate the speed-distance relationship and we combine this with our main results to underpin the relationship between average broadband speeds and educational attainment.
Although our main estimate may seem relatively small, we show that its effect size is economically meaningful. For each increase in the average broadband speed of 1 Mbit/s, test scores increase on average by 1.37 percentile points (5% SD in the national test score distribution).
In the mid-to-late-2000s, English teens used the internet for homework, and tools like YouTube existed. Our estimates have external validity today and can inform current policy. Currently, 59% of the world population is online and average worldwide speed in 2015 was 5.6 Mbit/s.
Conclusions: Our results show that home broadband speed matters for student performance to an extent comparable to many more direct inputs of educational production. Broadband technology, therefore, increases the importance of the home environment for learning.
The COVID-19 pandemic brought to the spotlight the unequal access to technology. Our results highlight the value added of broadband investments and the importance of ensuring universal access to mitigate increases in inequalities in educational opportunity.
(20/20) end/
(20/20) end/


 Read on Twitter


