The #Bitcoin  price is entirely driven by halving and momentum. The S2F model captures the halving effect and TA can help with the rest.
Here is the cycle chart and a thread on what is coming next.
 price is entirely driven by halving and momentum. The S2F model captures the halving effect and TA can help with the rest.
Here is the cycle chart and a thread on what is coming next.
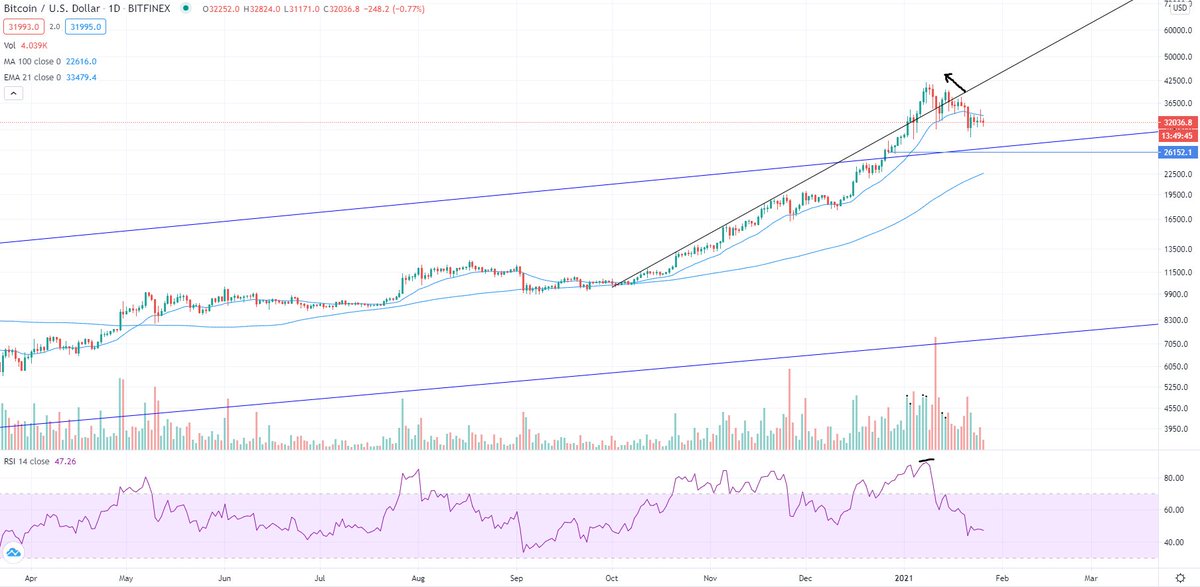
$BTC was overbought on the daily RSI, higher than at any point in the last cycle, we we're printing higher highs on lowering volume, and ultimately, we pulled too steeply away from the parabolic uptrend, all shown here. Therefore, a dip was necessary.
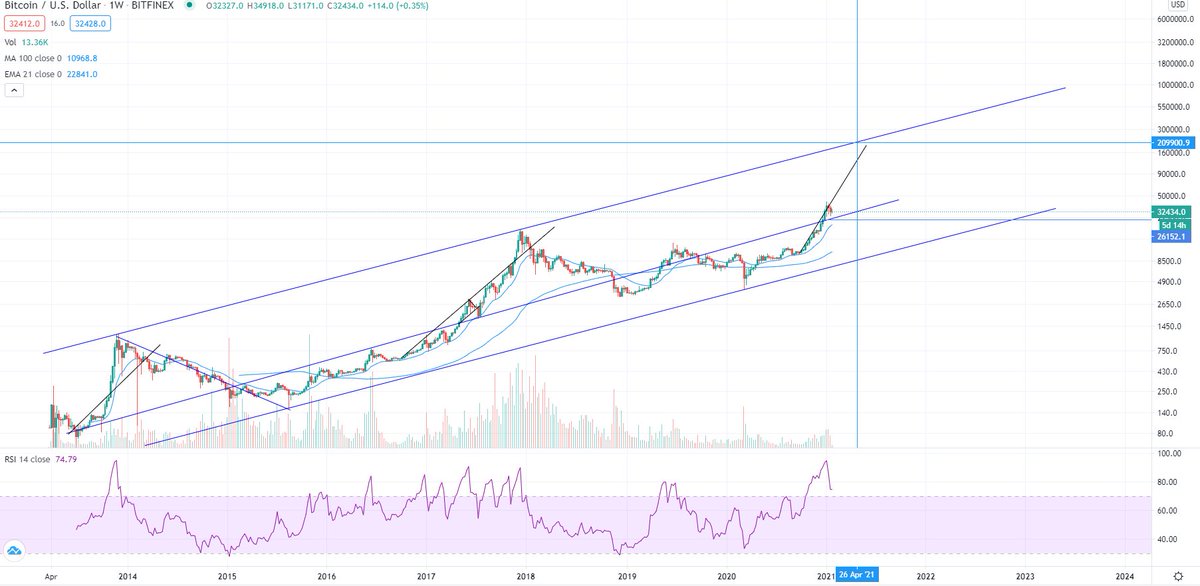
A dip does not mean the #Bitcoin  bull cycle is over. The parabolic trend will continue and is currently targeting $210k cycle top by end April/May. If we allow for momentum to overshoot, this agrees with the S2F model prediction of a ~100k cycle top in May.
 bull cycle is over. The parabolic trend will continue and is currently targeting $210k cycle top by end April/May. If we allow for momentum to overshoot, this agrees with the S2F model prediction of a ~100k cycle top in May.
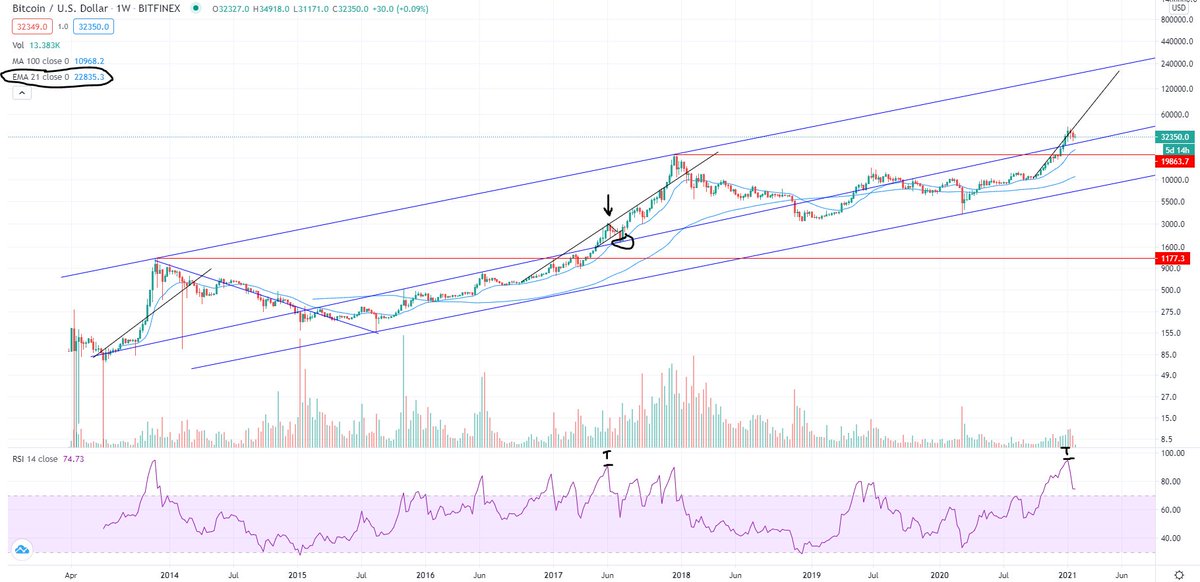
The 42k local top was similar to here in the last bull cycle. There's a several points to make here for both the ultimate cycle top and the current dip target bottom.
1) The daily RSI printed (94.8) will be the high for the cycle. Next time it is close will be the cycle top.
1) The daily RSI printed (94.8) will be the high for the cycle. Next time it is close will be the cycle top.
2) The comparable dip in the last cycle, and many other dips in the last cycle, touched the 21 week ema. That is currently $22800.
3) There is a trendline in the middle of the three which is frequently touched but hasn't been for a while.
4) The .5 (26.3k) and .618 (22.6k) fib retracements over the parabolic move so far give us targets in this region.
4) The .5 (26.3k) and .618 (22.6k) fib retracements over the parabolic move so far give us targets in this region.
5) Their are daily demand zones at 26.1k and 23.2k.
6) The daily RSI is heading for ~30.
Note that the 100 dma has crossed the previous cycle ATH, I don't think there is any chance the previous ATH will get revisited.
6) The daily RSI is heading for ~30.
Note that the 100 dma has crossed the previous cycle ATH, I don't think there is any chance the previous ATH will get revisited.
So you see, lots of uncertainty around the dip bottom but all targets are significantly lower. A fake out upwards of the consolidation could allow the 21 week ema to cross the trendline, then a savage dip to the trendline would also cross the 21 week ema. This is my current idea.
The fake out then dip would look something like this on a 4 hour chart, with the steep dip occurring next week, so patience is needed. That would make right now a good short term long, but any position entered now until we see this dip is high risk imo.

 Read on Twitter


