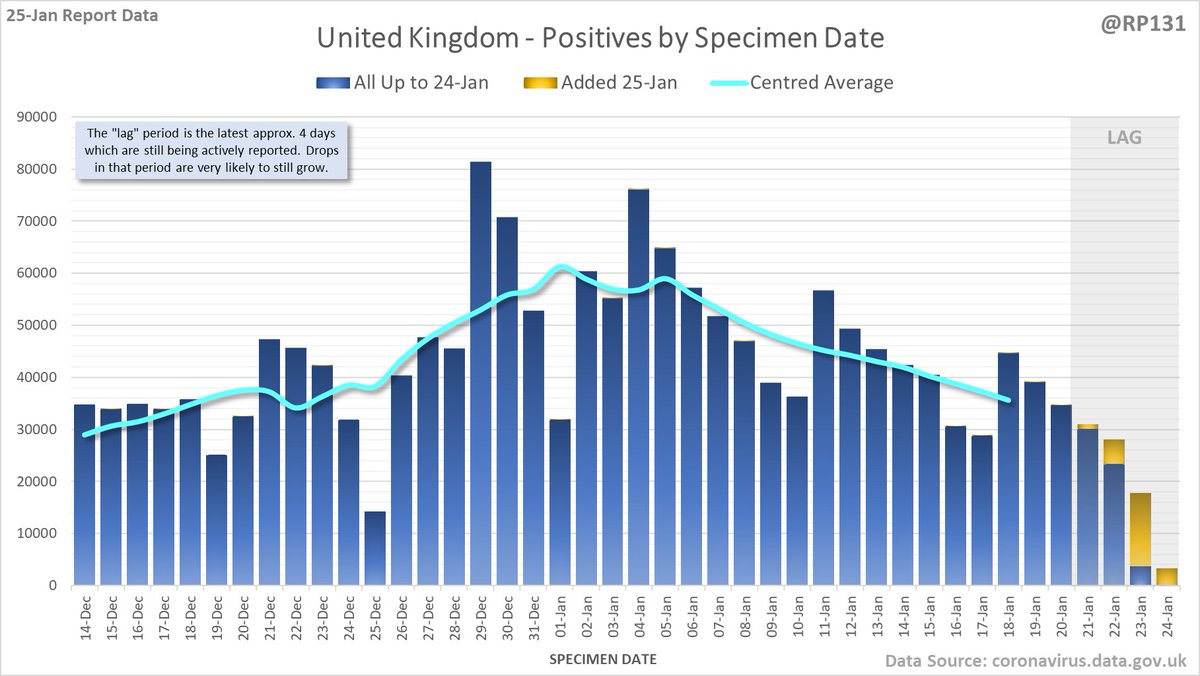
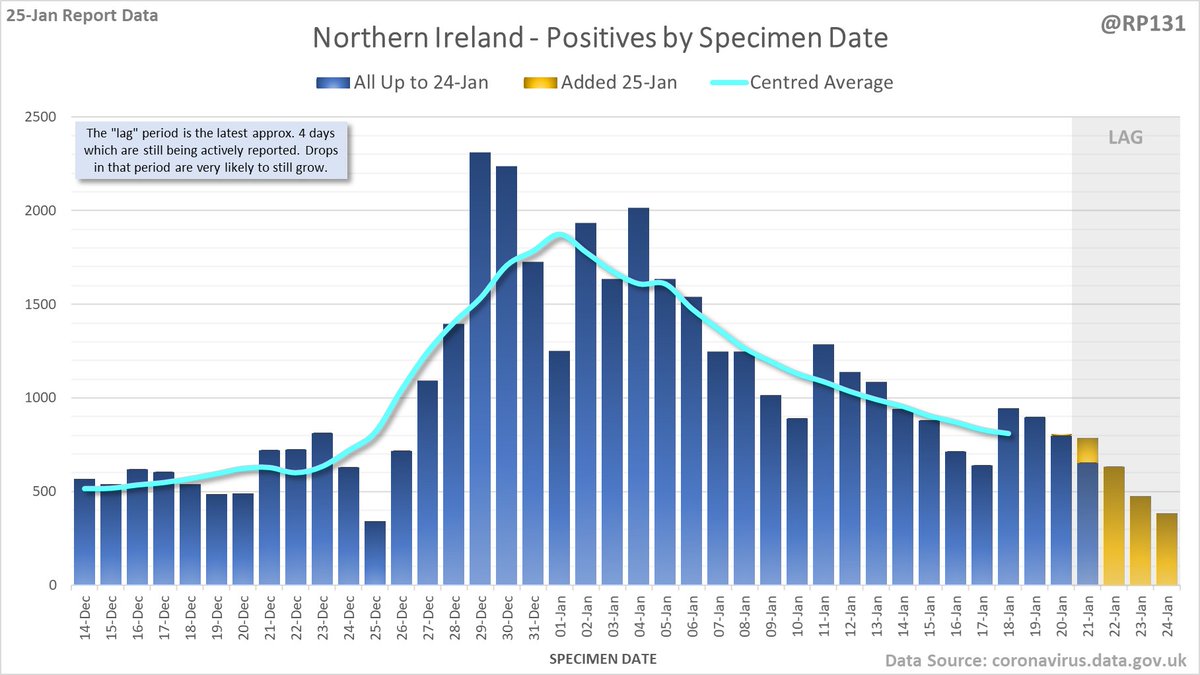
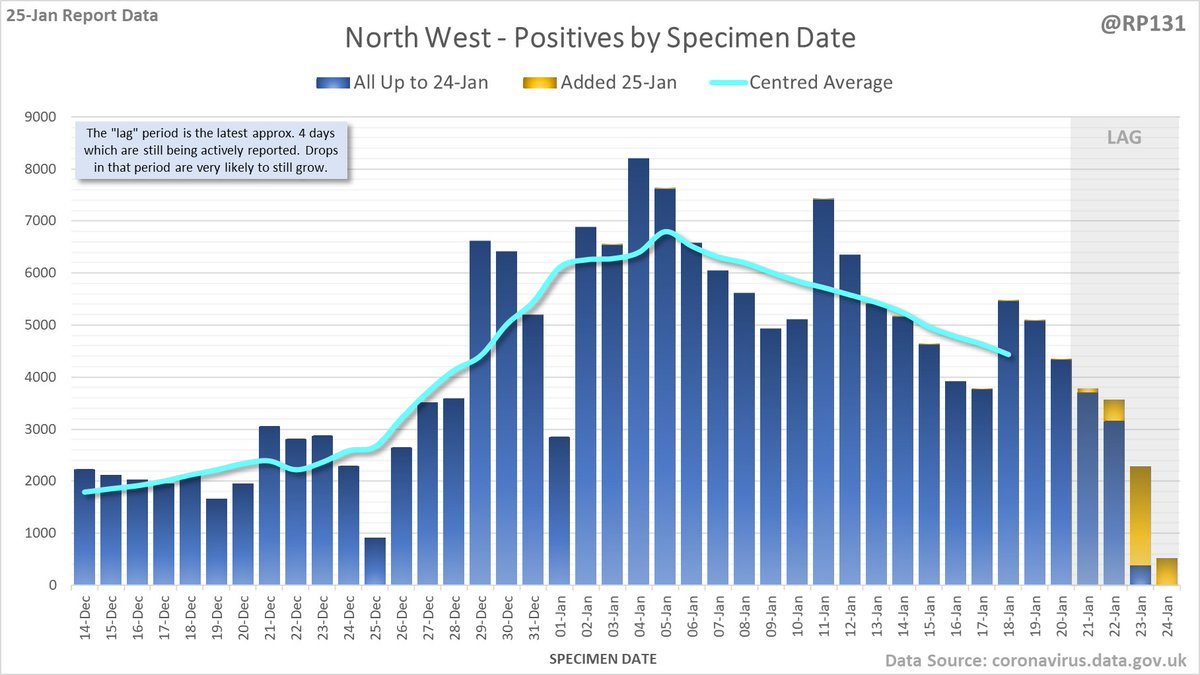
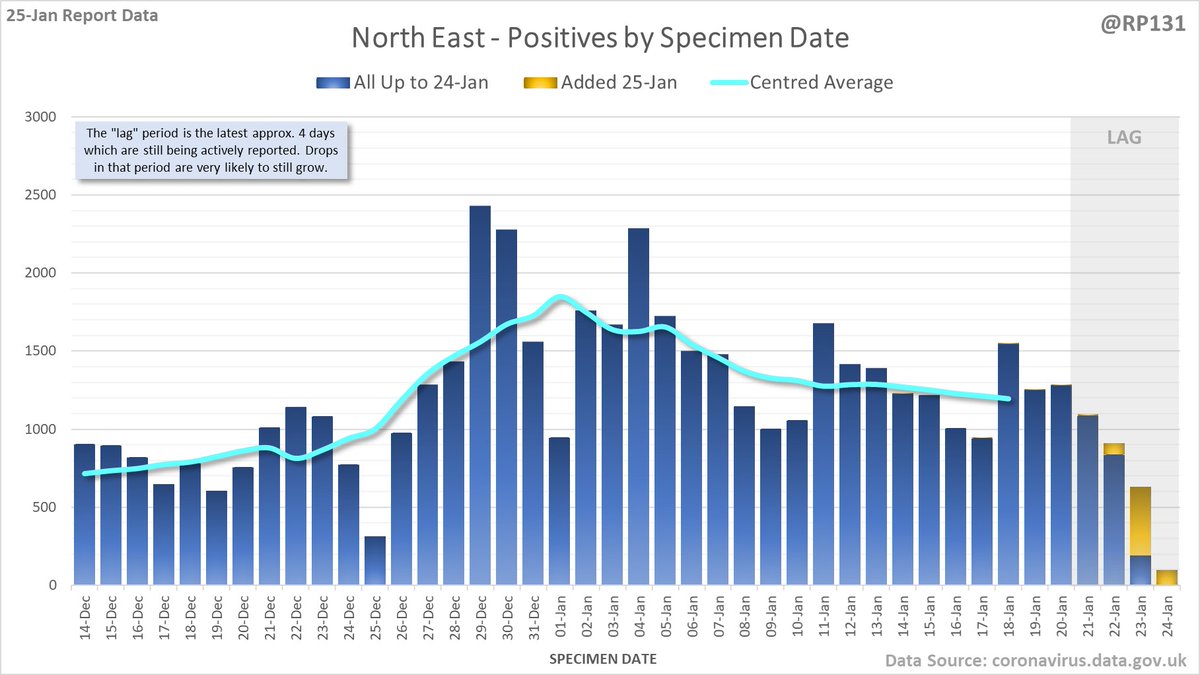
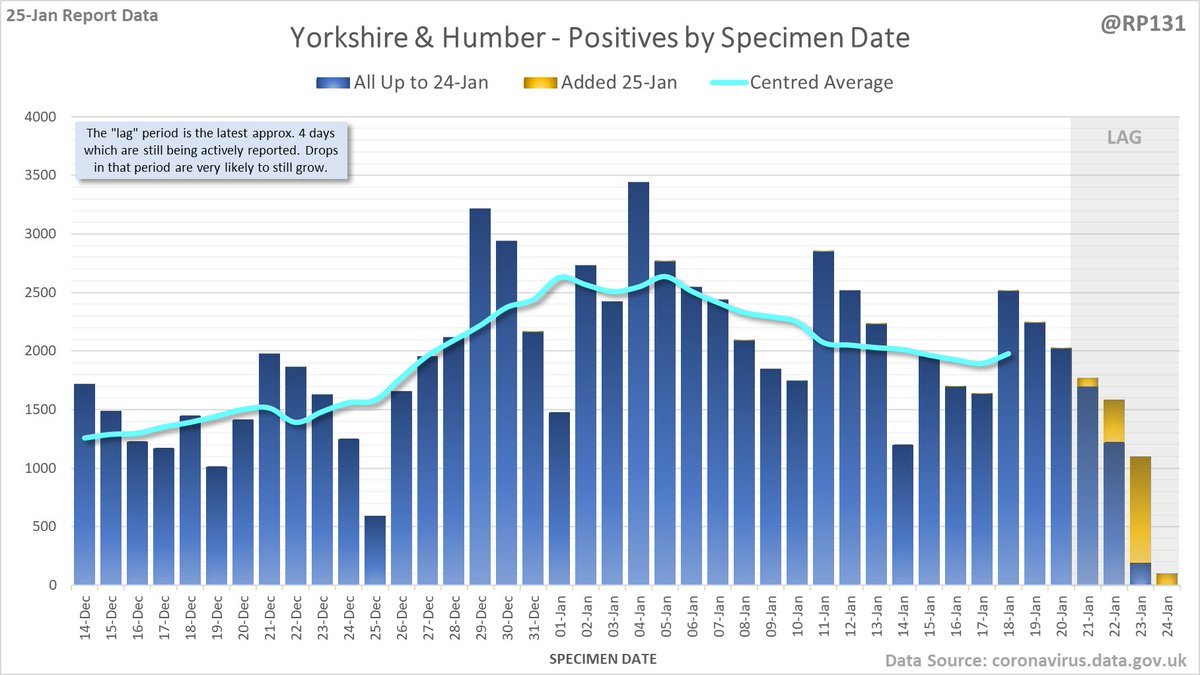
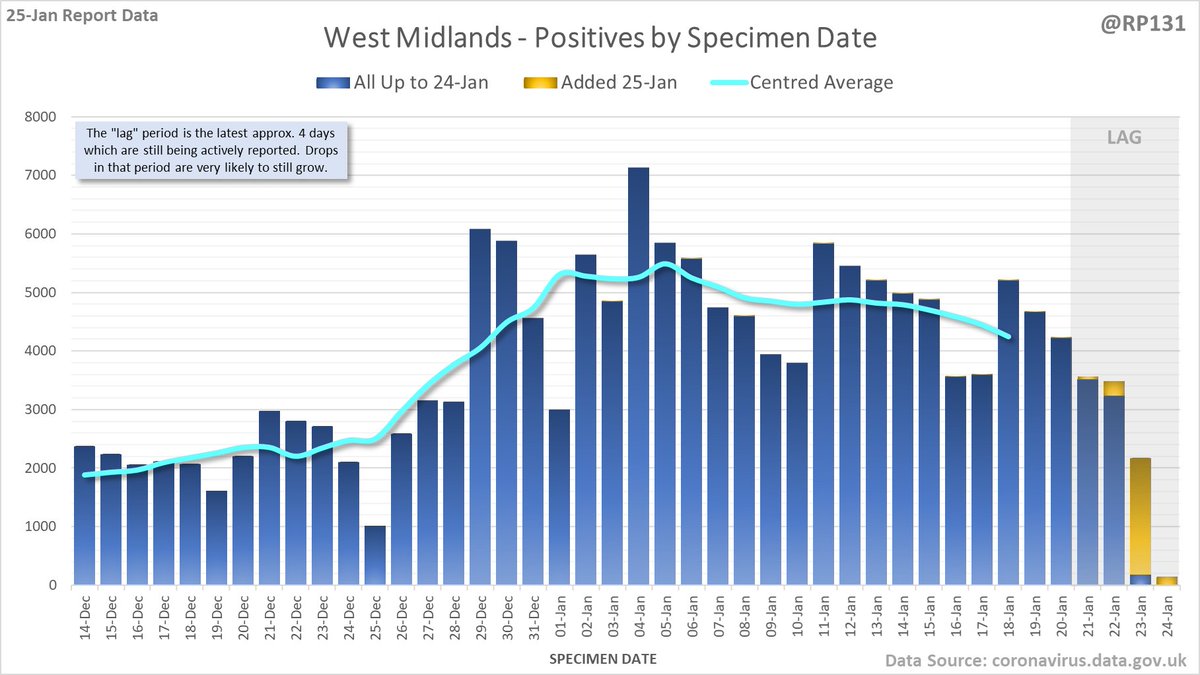
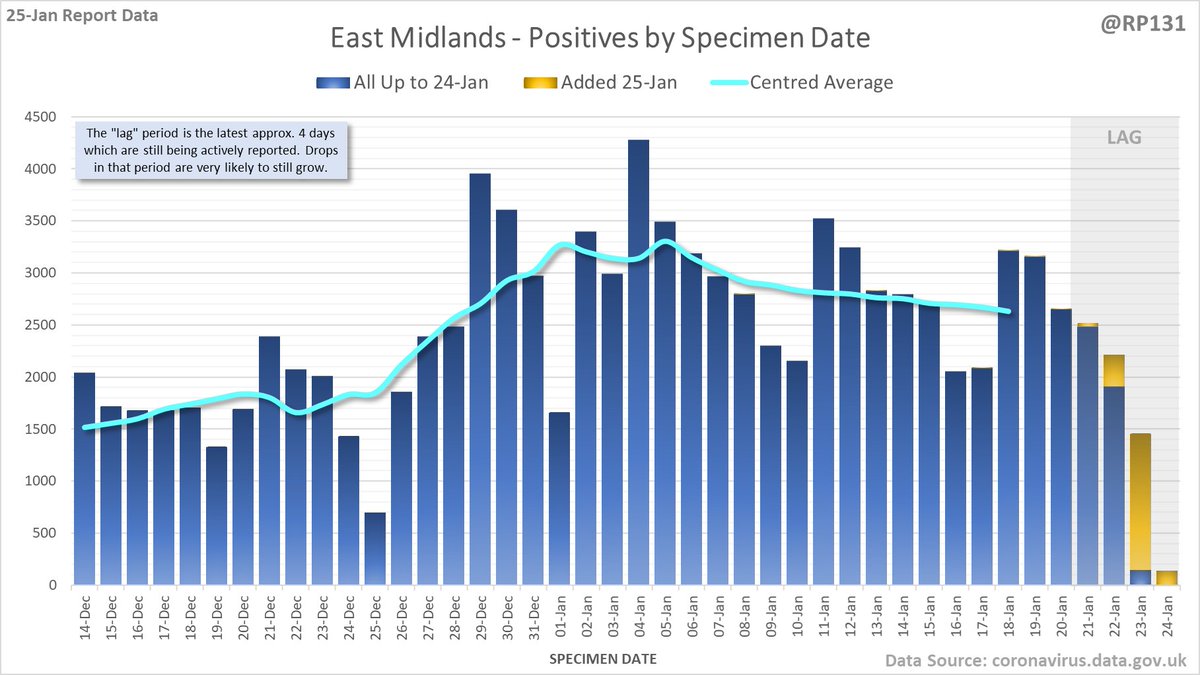
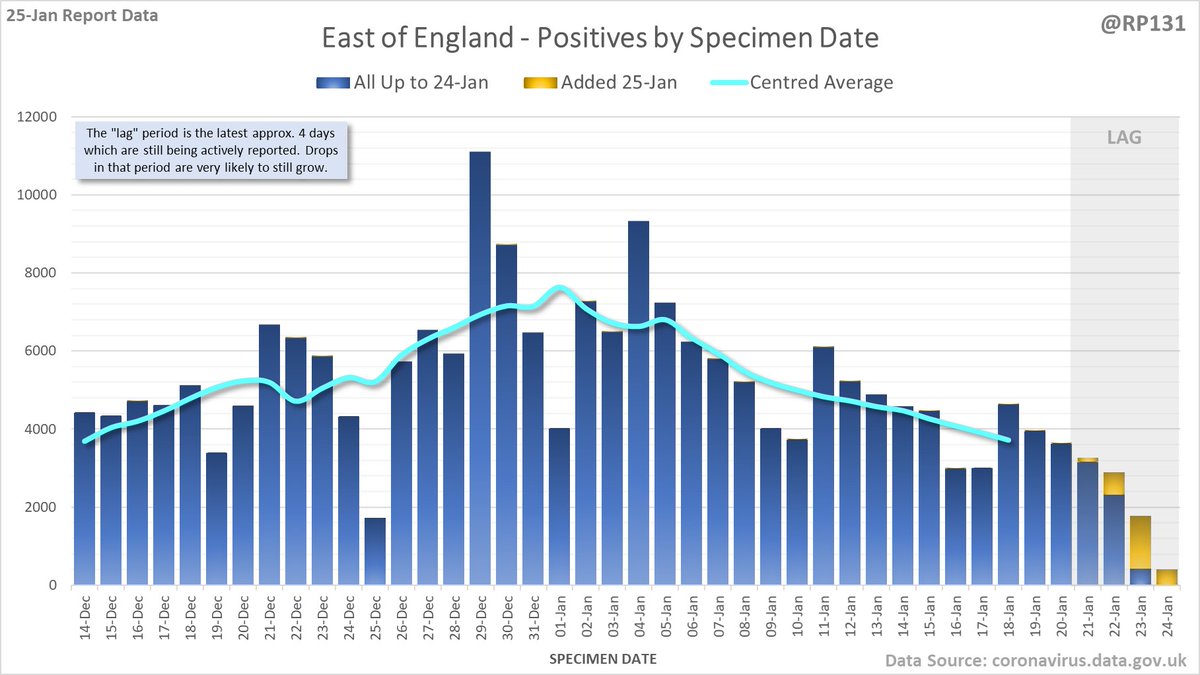
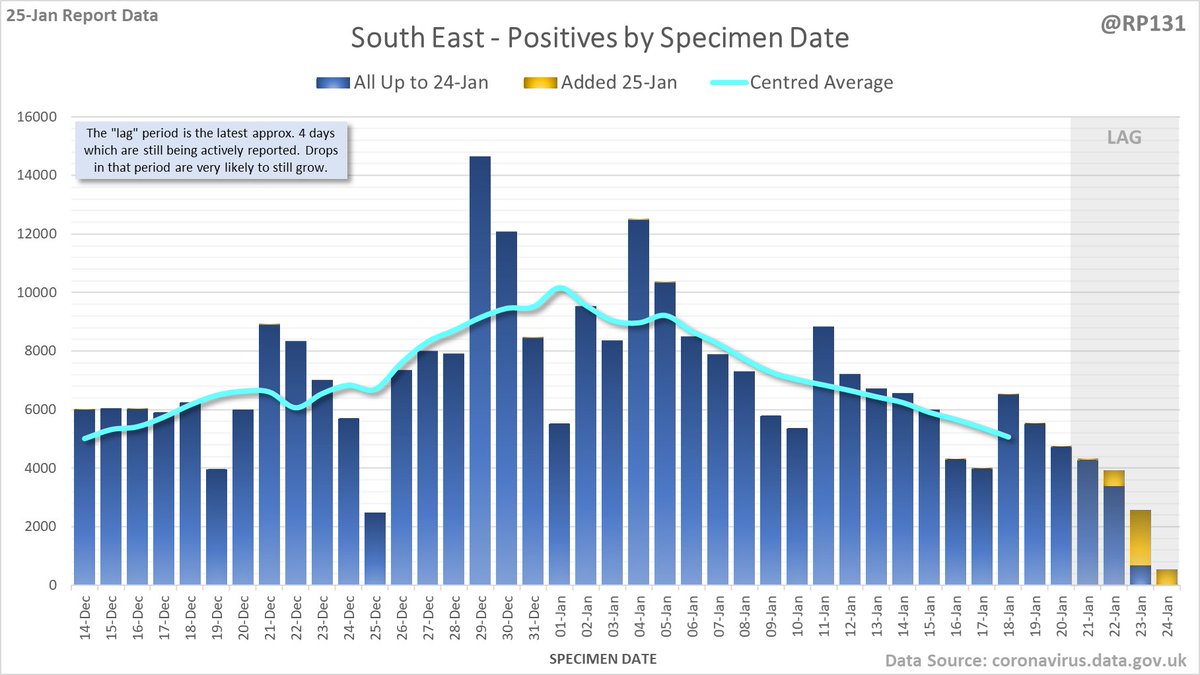
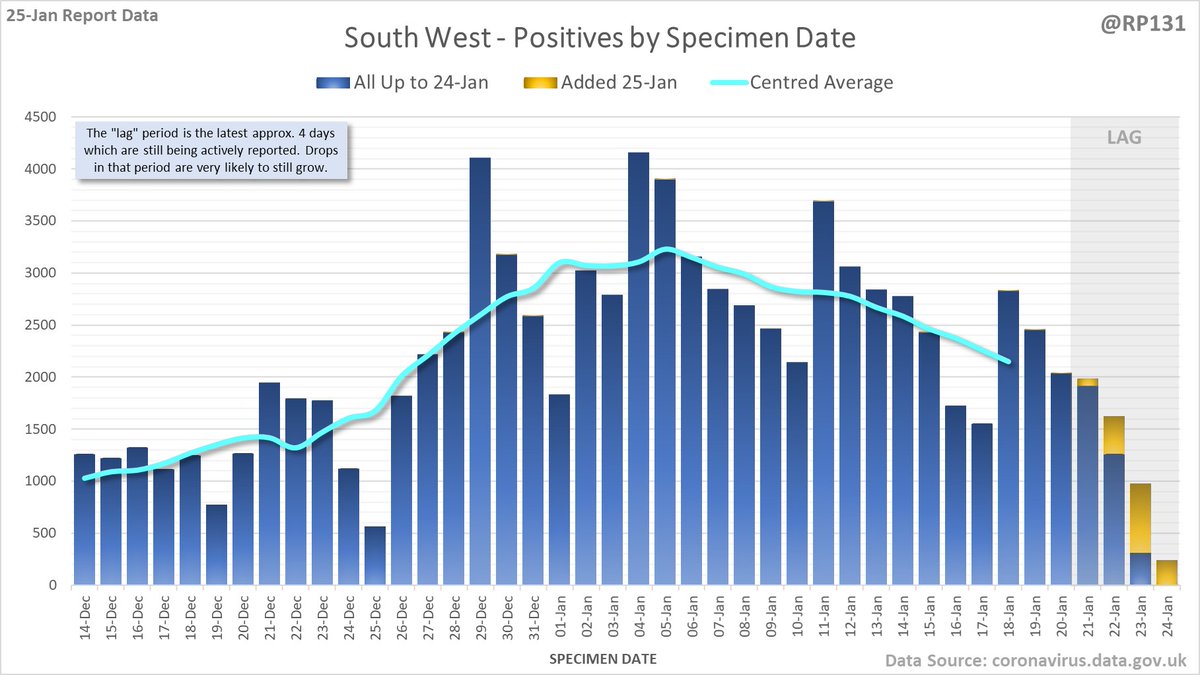
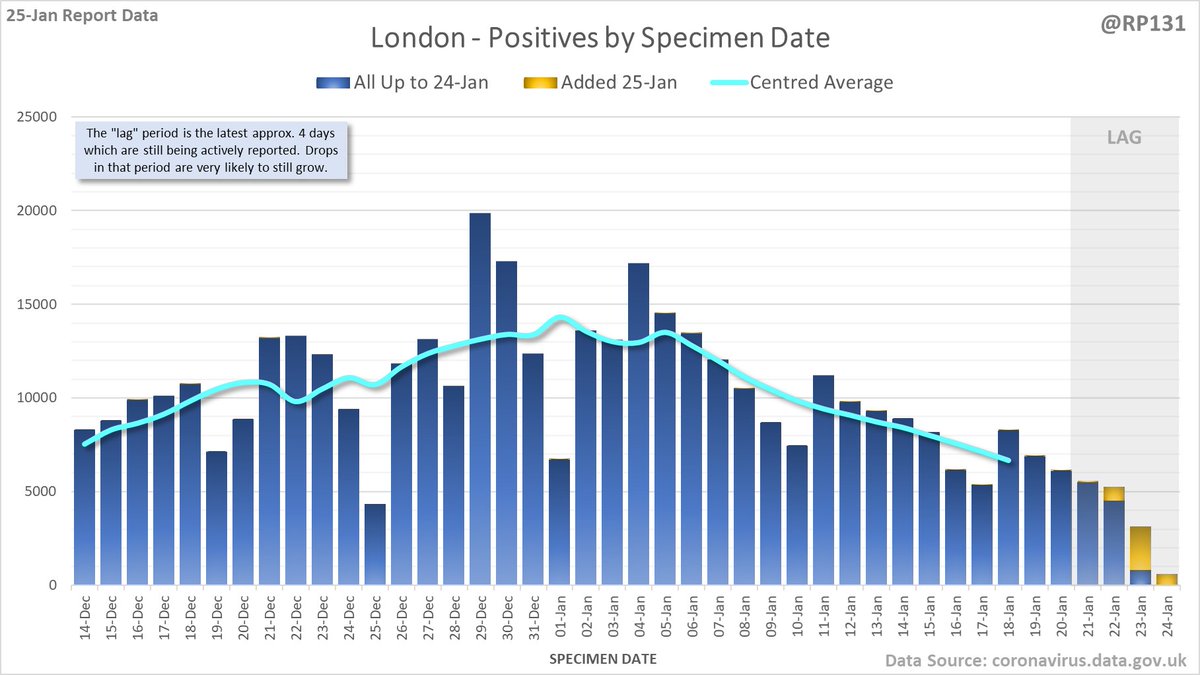
22,195 new #covid19uk positives reported today (25-Jan). Below is a chart of the latest data available by Specimen Date (the date the person took the test) with today's added numbers highlighted in yellow. More naton / region charts further down the thread.
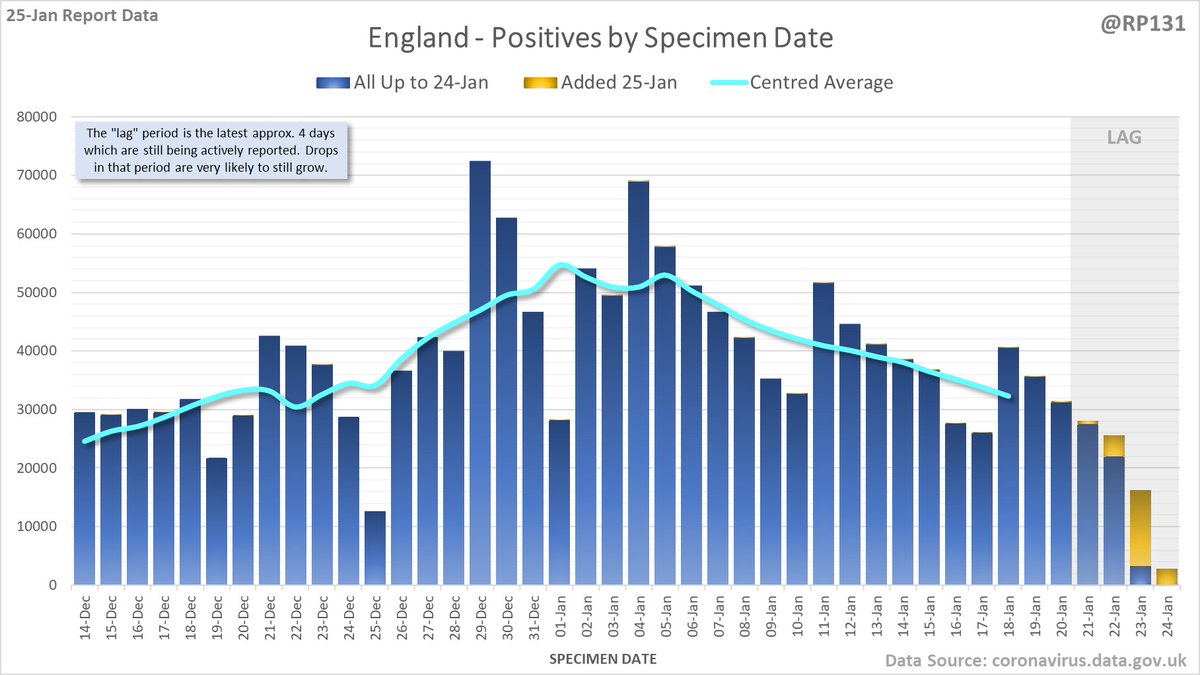
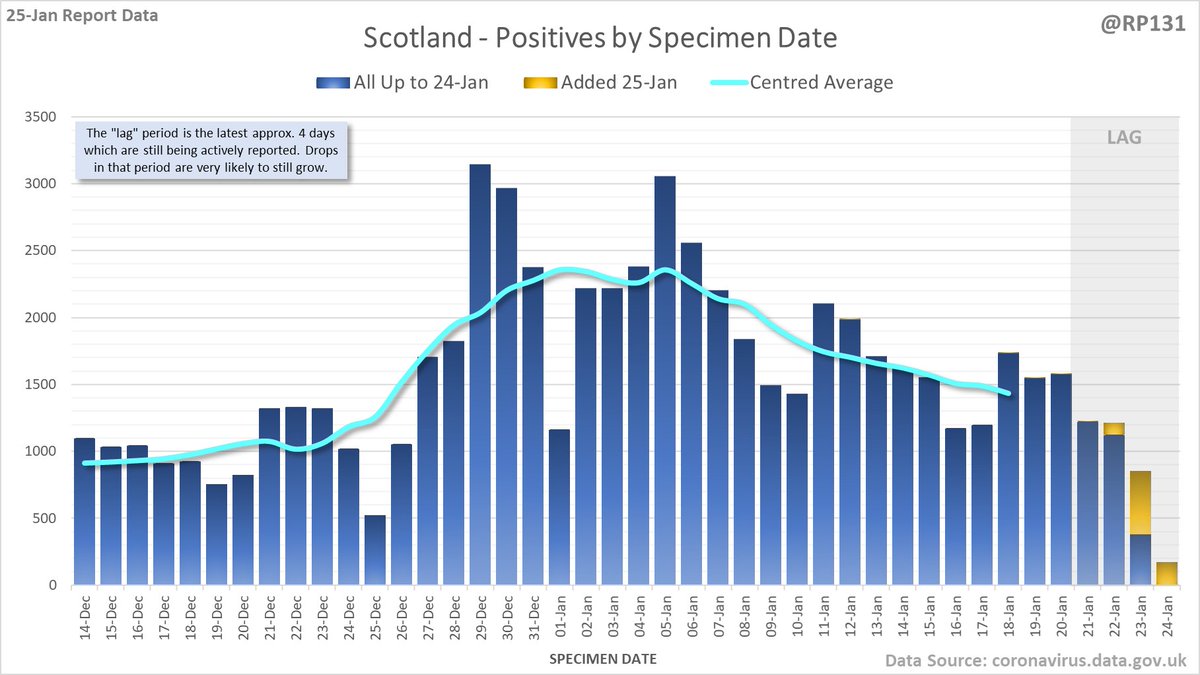
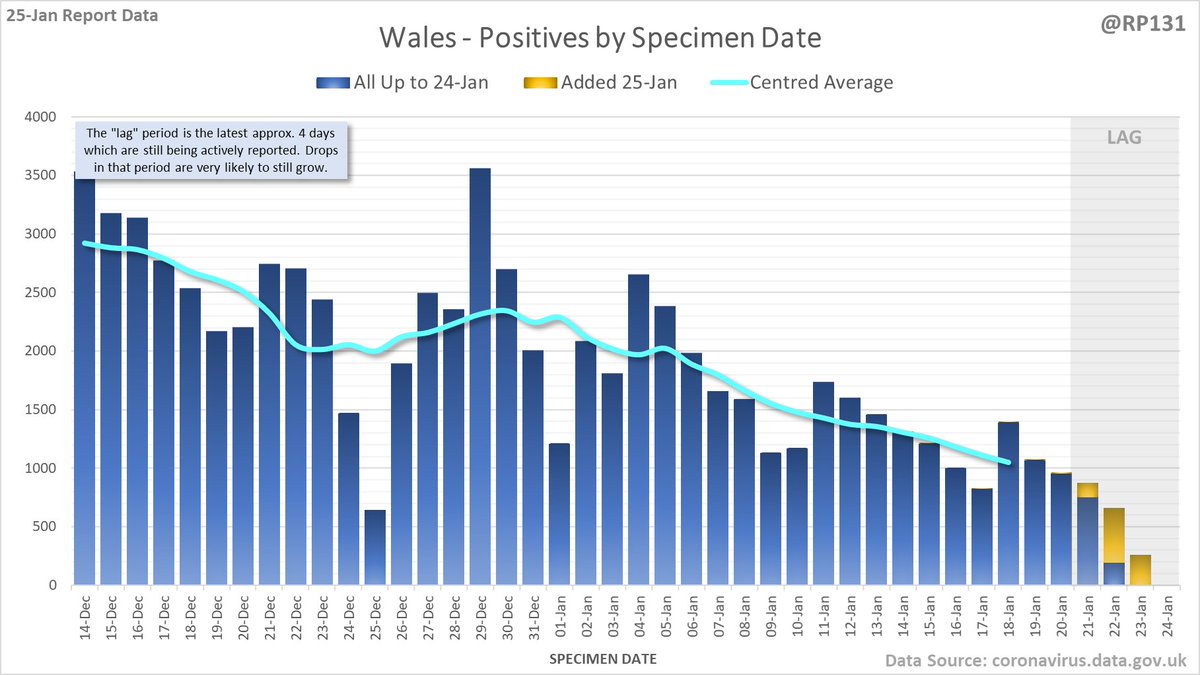
Separate charts for England (20149) Scotland (752) Wales (872) and Northern Ireland (422). Note the different scales. Also on certain days the specimen-date data for Scotland/Wales/NI doesn't get updated so the yellow bars may be mising or include multiple day's numbers.
And England regions, starting with North West, North East, Yorkshire & Humber and West Midlands. Again, note the different scales.

 Read on Twitter