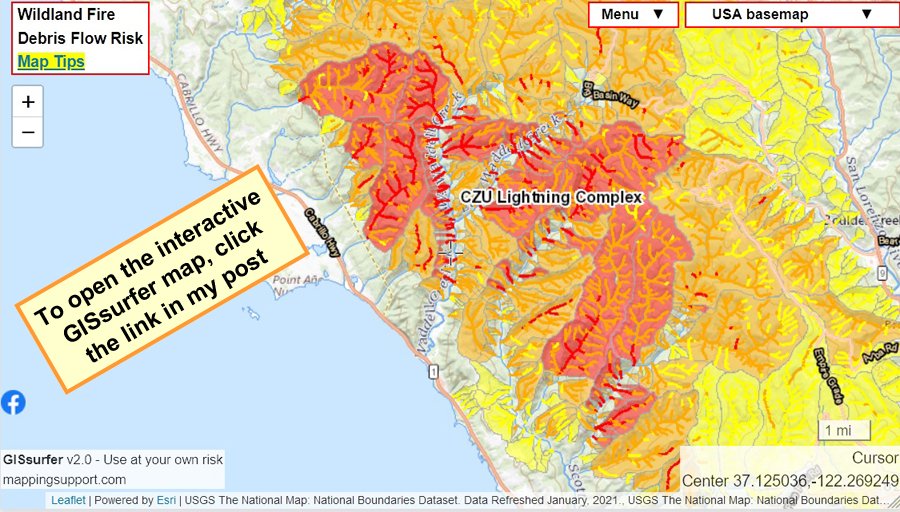
1/_ Interactive #GIS map showing risk of #DebisFlow for wildland fires. For the legend and to get the most benefit from the map, please click “Map tips” in upper left corner. To search on address click Menu > Search. #CAwx
Open #GISsurfer map: http://bit.ly/39Y5BRA
Open #GISsurfer map: http://bit.ly/39Y5BRA
2/_ The map opens at the #CZULightningComplex. You can pan the map to other 2020 fires and see the same type of data. Be patient! The map might be slow to refresh. It depends in part on how much other work the GIS server is doing.
3/_ The map can display the risk of debris flow for fires back to 2017. Here is one way to make a map to see the risk of debris flow for a fire prior to 2020:
A. Click the basemap button and look under the “Overlays” heading
B. Click “Turn off all overlays”
A. Click the basemap button and look under the “Overlays” heading
B. Click “Turn off all overlays”
4/_
C. Pan the map to the approximate area.
D. Click the basemap button, look under the “Overlays” heading and turn on layers in the following order:
ESRI roads and labels
State boundary
(year) Basin combined hazard
All streams rivers lakes
Segment combined hazard
C. Pan the map to the approximate area.
D. Click the basemap button, look under the “Overlays” heading and turn on layers in the following order:
ESRI roads and labels
State boundary
(year) Basin combined hazard
All streams rivers lakes
Segment combined hazard
Fire name (does not work for 2017 fires)
E. Finally click “Menu” ==> “Link to this map”
The link that is displayed will replicate the map on your screen.
I recommend you run that long link through a link shortener. I use https://bitly.com
E. Finally click “Menu” ==> “Link to this map”
The link that is displayed will replicate the map on your screen.
I recommend you run that long link through a link shortener. I use https://bitly.com
Oppsie - I just checked this #GIS server, Turns out that it no longer has data for the 2017 wildland fires. I will delete the 2017 layers from the list of layers that the map can display.
Typo in the first post in this thread.
The hashtag should be #DebrisFlow
The hashtag should be #DebrisFlow

 Read on Twitter


