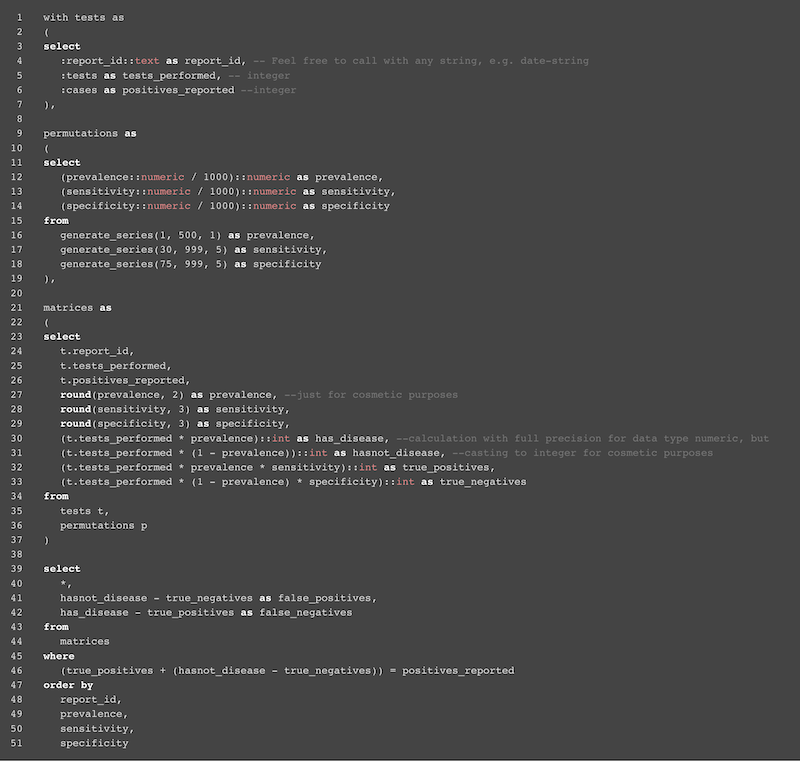
1/ Happy to announce that we have submitted our #paper ‘Bayes Lines Tool (BLT) - A SQL-script for analyzing diagnostic test results with an application to SARS-CoV-2-testing’.
In this thread
 , I will explain why our tool is that powerful for decision makers. #UnbiasedScience
In this
 thread
 , I will explain why our tool is that powerful for decision makers. #UnbiasedScience
2/ In the meantime, the submitted paper is available on the preprint platform @zenodo_org. Factual criticism is highly desired and encouraged. The publication itself presents a seminal Bayesian calculator, the Bayes Lines Tool (BLT). (Petje af, @waukema!) https://zenodo.org/record/4459271#.YAwjxhYxk2w
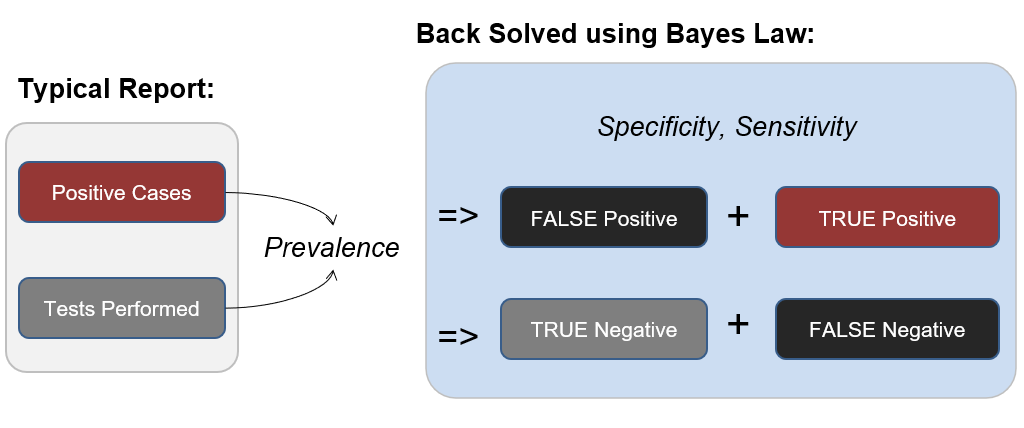
3/ The Bayes Line Tool (available on https://bayeslines.org ) is able to back-solve disease #prevalence, test #sensitivity, test #specificity, and therefore, true positive, false positive, true negative and false negative numbers from official governmental test outcome reports.
4/ This is done by creating confusion matrices with four variables. Namely: TP, FP, TN, FN. In order to calculate the matrices, we need prevalence, specificity, and sensitivity as well as the number of people that got tested (within a given period) and the number of positives.
5/ The number of positives and the number of tests are given by the government. Prevalence, specificity, and sensitivity are unknown. So we assume any combination of them ranging from 0-99%. These three combinations can amount up to #millions of #combinations.
6/ Typically, we calculate with 7 million combinations. Of these 7 million combinations, only 1-100 usually match the numbers that the government gave us (e.g. TRUE Positives + FALSE Positives = amount of performed tests).
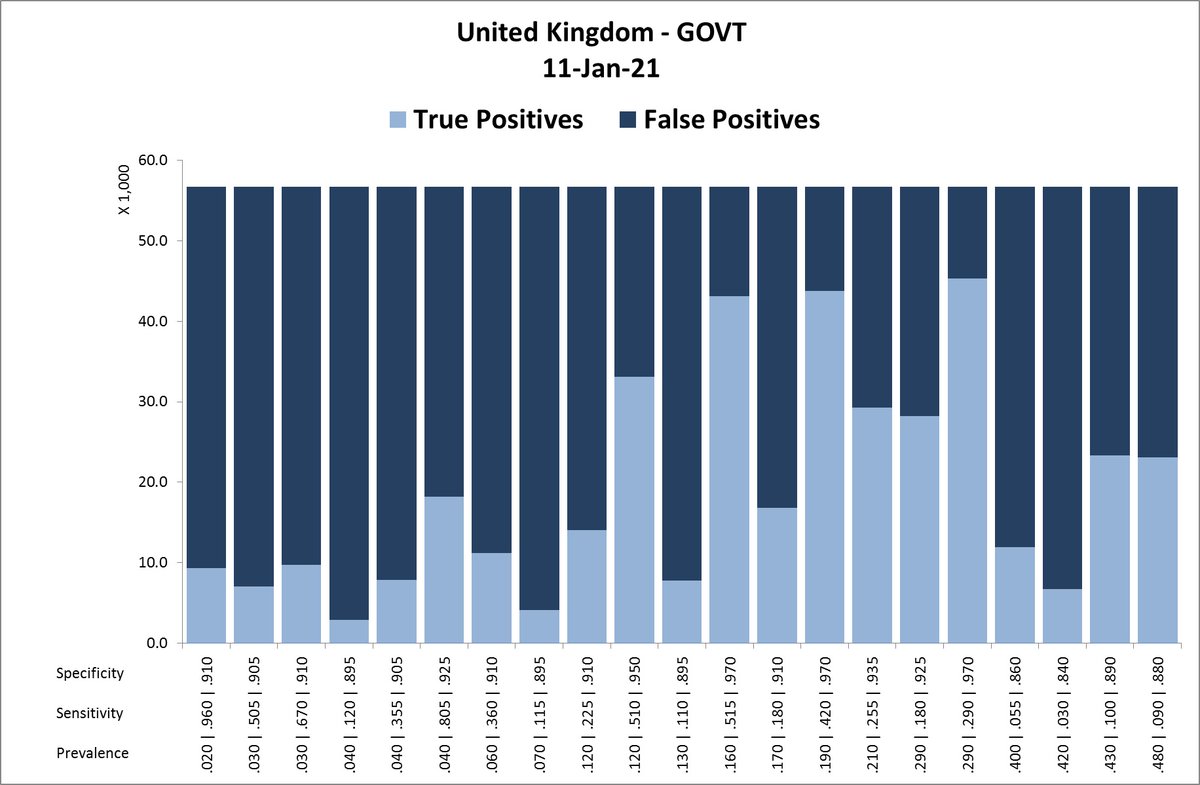
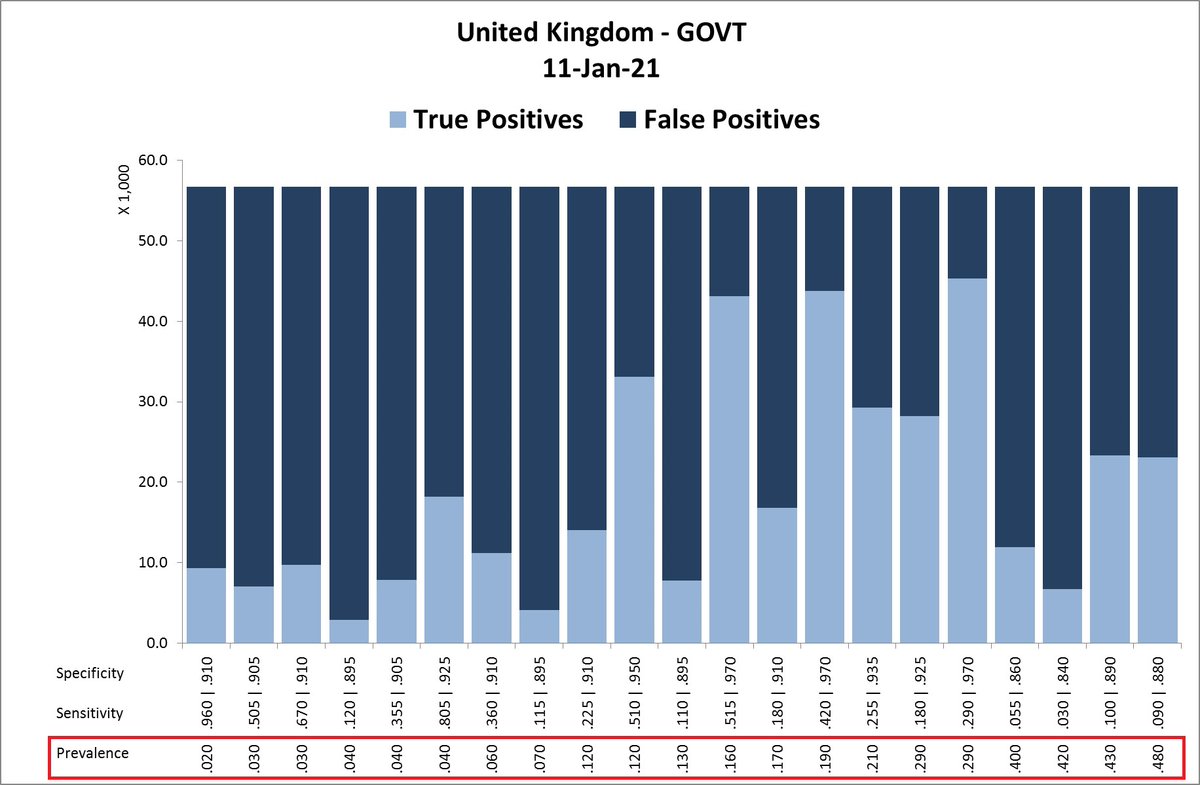
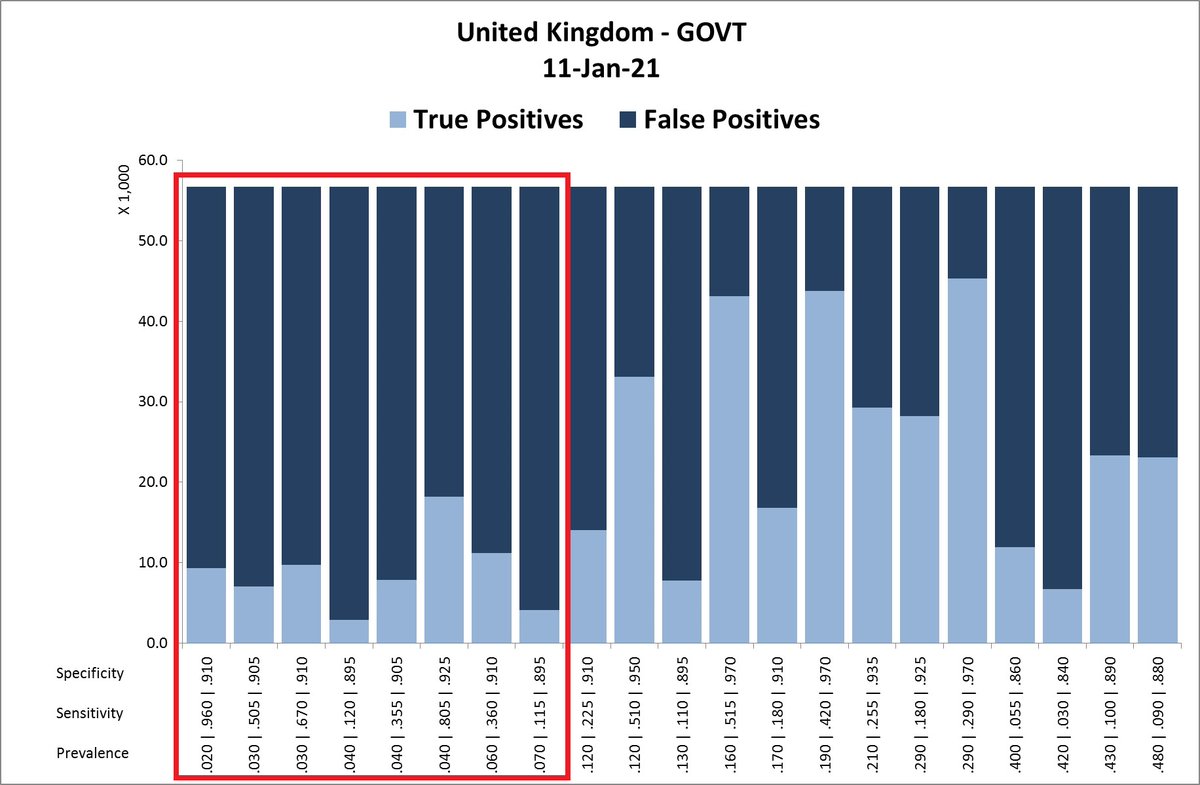
7/ For the 11 Jan 2021, 536,947 tests were performed, resulting in 56,733 reported positives. The confusion matrices contained 21 possible matches for that day, represented in the #columns. We have sorted the columns by ‘prevalence’, as marked in red.
8/ The prevalence in the UK is currently presumed to be 1,52% ( https://bit.ly/3sRFSmw ). Given the fact that reported positives dropped by 43% since January 8, we are looking at a prevalence of around 3%, but definitely lower than 12%, leaving us with the following options:
9/ Looking at the bars will already give you a good #indication on the test result in the context of everyone else who got tested in the population. This means that the model tells us whether the test results are/were #relevant.
10/ In the next steps, I will show you how to figure out which event might most likely have been the one that occurred that day, figuring out the real TP/FP rate, test specificity and sensitivity and prevalence. For this, let’s take a look at the tests' sensitivity.
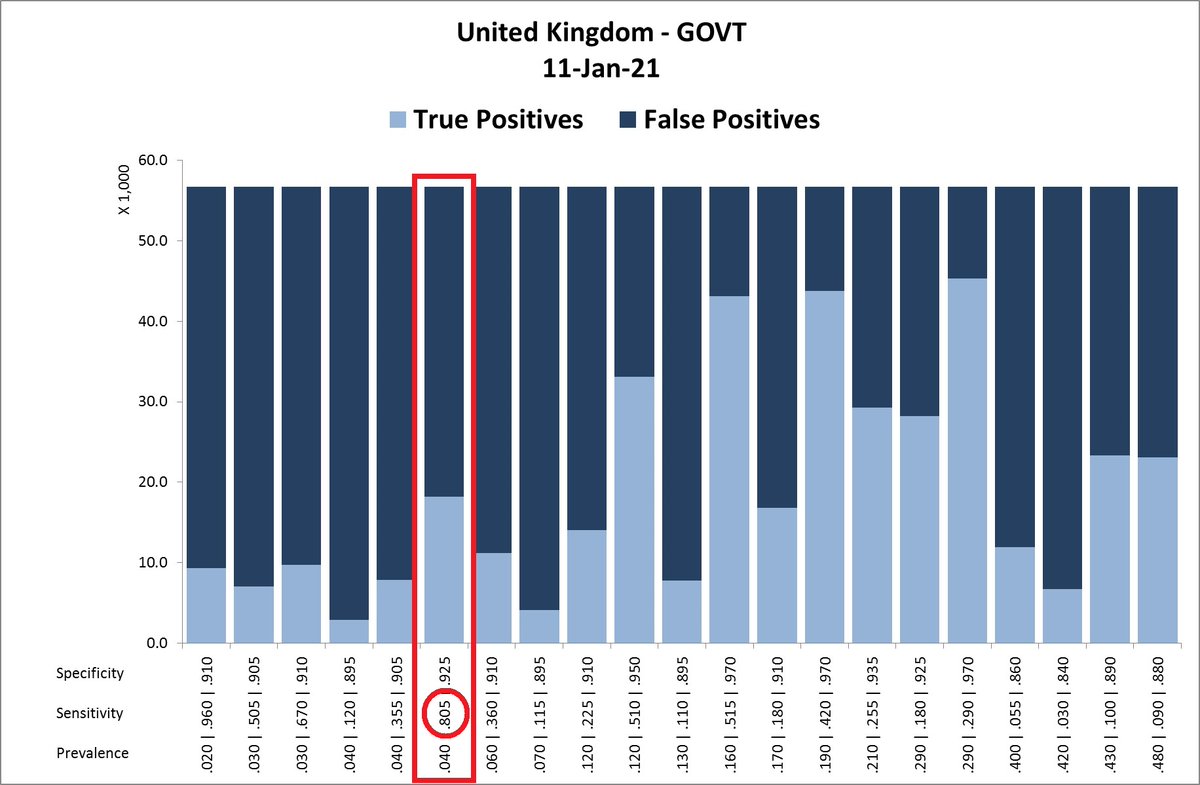
11/ In the UK antigen and PCR tests are used. Antigen tests have a sensitivity between .664 (66.4%) and .738 (73.8%) ( https://bit.ly/2Y5konY ). PCR tests about .842 (84.2%) ( https://bit.ly/3ogUAj7 ). PCR tests constitute the majority of tests that are used in the UK.
12/ We are consequently looking for a sensitivity value just below .842. #BINGO! By just getting the amount of performed tests and number of reported positives from the government, we can conclude the actual specificity, sensitivity, and prevalence.
13/ So on January 11th, the prevalence was most likely about 4%, the tests’ sensitivity about 80.5%, and the tests’ specificity about 92.5% (which is much lower than the claimed 98.9%: https://bit.ly/2Y5nEjf ). The false-positive rate that day would consequently have been 68%!
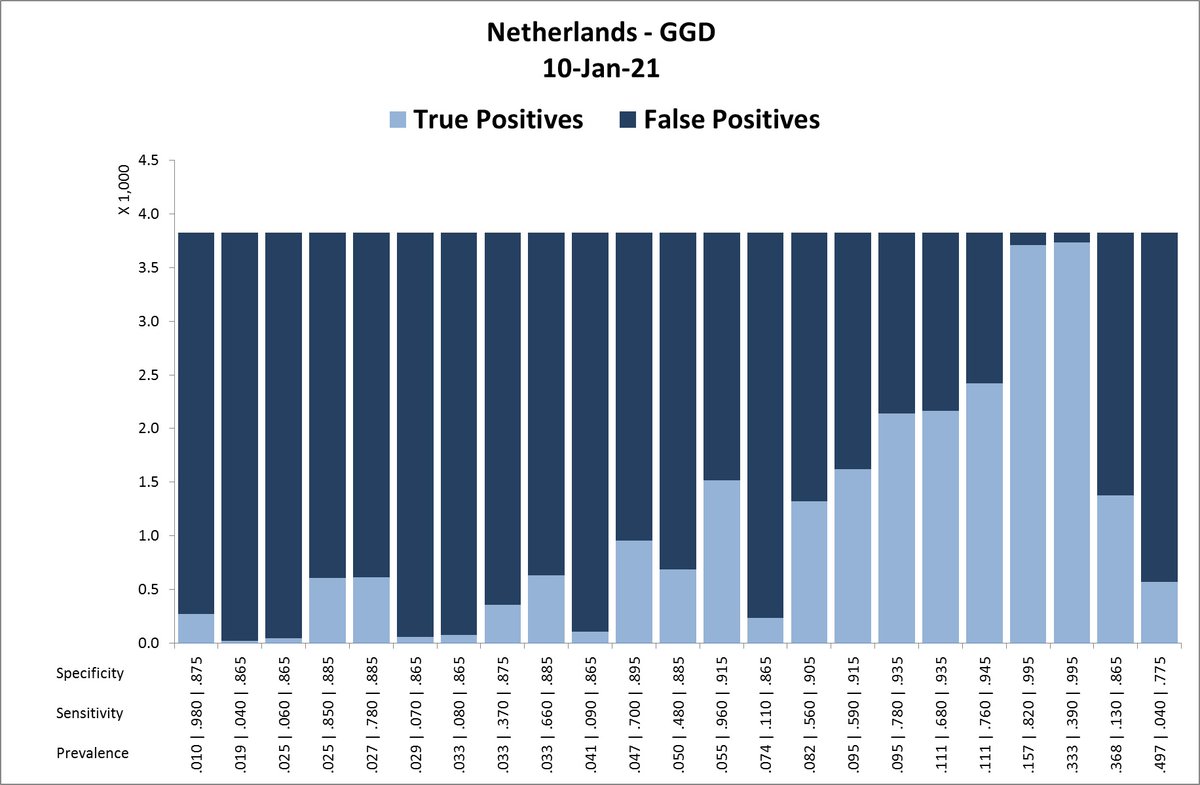
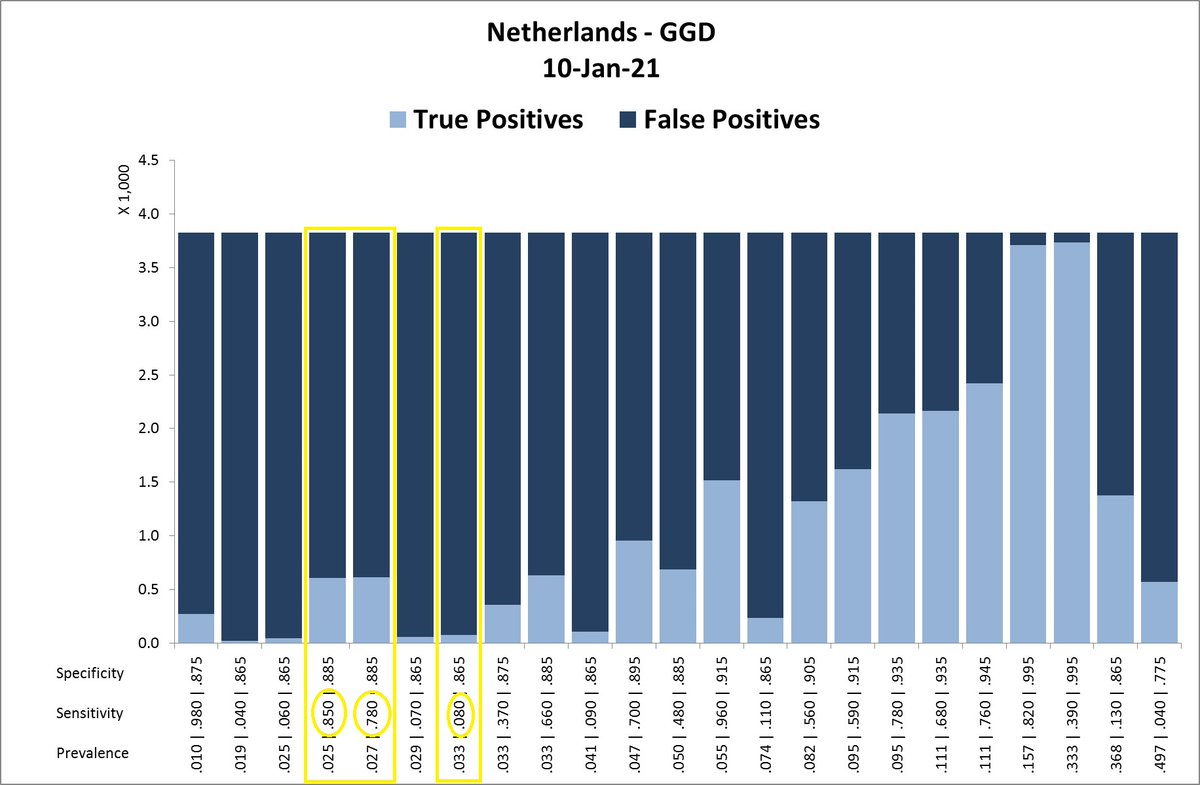
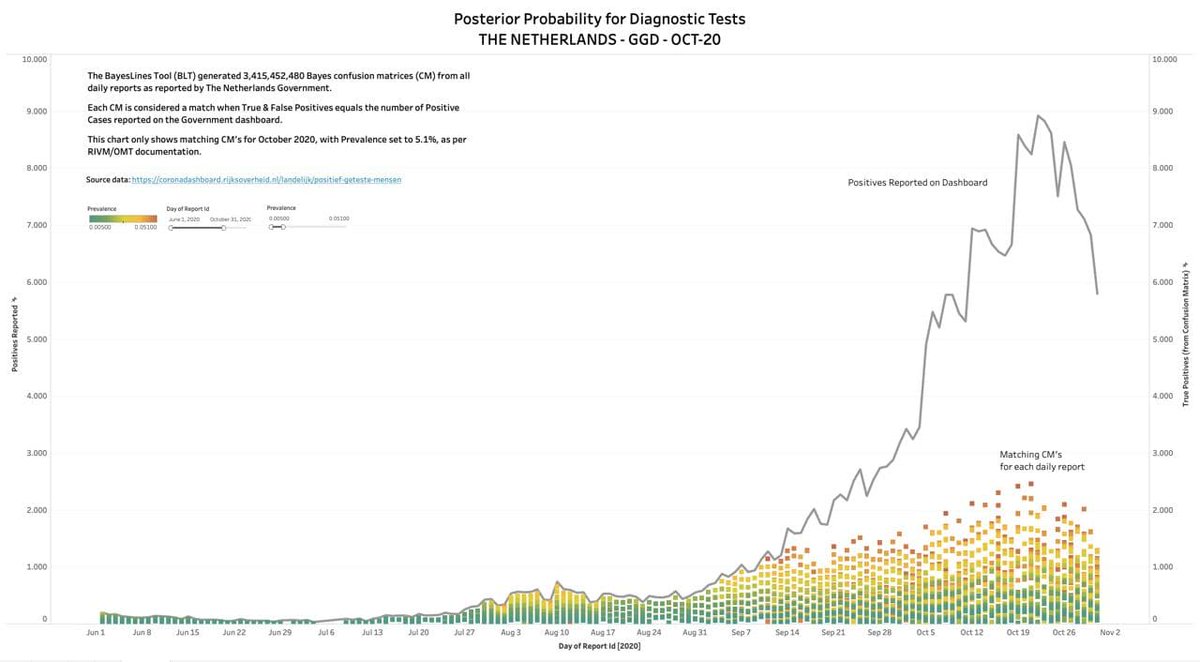
15/ AFAIK, the #Dutch government did not make a recent comment about prevalence, but we can assume a similar one as in the UK. Also, the sensitivity should be in the range of 75-85%, leaving us with the following possible scenarios. Remark: note the low #specificities < 90%.
16/ The model’s outcomes are extremely valuable in that they can provide a decision-making tool for people in charge (i.e. #politicians, #physicians, #policymakers etc.) and support them in evaluating their strategy for fighting the disease. #COVID
17/ This time-series can be further back-solved by solving single events following the #exclusionprinciple and consequently receiving insights with respect to the tests’ specificity/sensitivity or the prevalence within the population.
18/ This method provides the light (i.e. better insights) for individuals, authorities and governmental agencies that are currently in the dark with measuring problems and often using imprecise prediction models.
19/ Furthermore, the outcomes can provide a better insight into the expectable operational effectiveness of the tests (specificity/sensitivity) compared to the theoretical commercial claims of the manufacturers (equipment, primers, probes, supplies etc.).
20 Last but not least, the tool can also be used to provide extensive time-series (see graph). If you want to be the first to receive updates around our Bayes Lines Tool feel free to join our #UnbiasedScience-Telegram channel via the following link: https://t.me/unbiasedscience
21/ P.S. Here is another brilliant thread on Bayes’ Theorem that you might want to read. (Outstanding work @robinmonotti) https://threadreaderapp.com/thread/1336593397608542208.html
Take-away message for the layperson. What we see is most likely the following:
- Extremely high rate of false positives
- Much lower test specificity than reported by the test manufacturers
- Overestimation of the prevalence
- Extremely high rate of false positives
- Much lower test specificity than reported by the test manufacturers
- Overestimation of the prevalence

 Read on Twitter