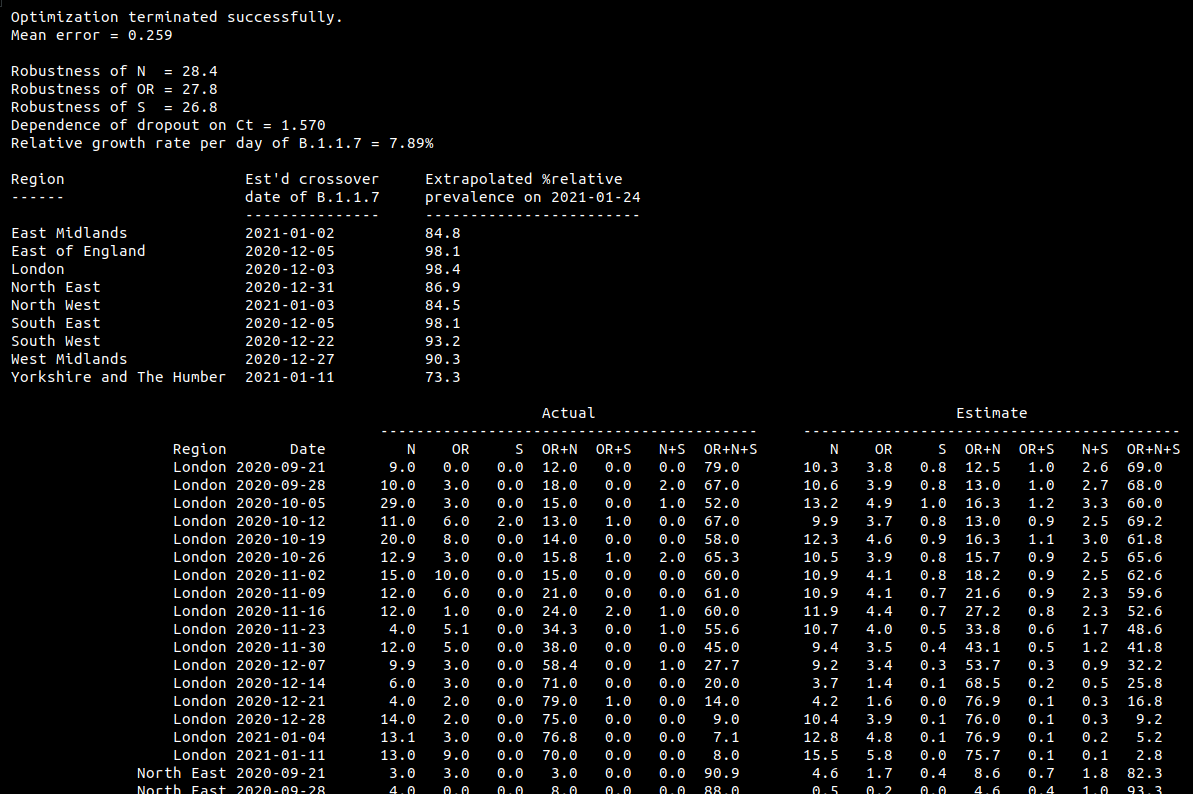
Here (a few tweets down) is a model of the prevalence of B.1.1.7 based on the breakdown of PCR tests by genes N, OR and S. This follows the ONS infection survey report on 22 Jan https://www.ons.gov.uk/peoplepopulationandcommunity/healthandsocialcare/conditionsanddiseases/bulletins/coronaviruscovid19infectionsurveypilot/22january2021#positive-tests-that-are-compatible-with-the-new-uk-variant which appeared to show the variant decreasing, but was probably wrong,
1/x
1/x
as explained in this excellent thread by @theosanderson https://twitter.com/theosanderson/status/1352669515583279105. The probably being that they don't count N-only and OR-only as "new variant compatible". In his post, @theosanderson shows
2/x
2/x
that the average Ct value of a region is strongly correlated with the dropout rate https://twitter.com/theosanderson/status/1352669522541637633, presumably because higher Ct correlates with testing people with lower viral loads. Following on from this, it is possible
3/x
3/x
to build a relatively simple model which predicts the dropout rates of the three separate genes. We are missing information about the Ct values for each gene of each test, but we can average over a range of possibilities to (attempt to) account for this statistically.
4/x
4/x
The model has a separate param for the fragility of each of N, OR and S, and finds that S is most fragile followed by OR. I hope this is biologically plausible. This allows it to account for the observation that if S is present, then N and OR are almost always present too.
5/x
5/x
The code is available here https://github.com/alex1770/Covid-19/tree/master/dropoutmodel (and includes a csv file provided by @theosanderson, from the ONS data annex). The results show a reasonably close match to the provided table of dropout proportions.
6/x
6/x

 Read on Twitter


