Over last few weeks, there has been much reporting on COVID-19 in schools. One question I've had is about reports of COVID-19 cases of children in schools by mode. My main question is whether in-person counts should also be combined with hybrid in analyses? Here's a quick thread.
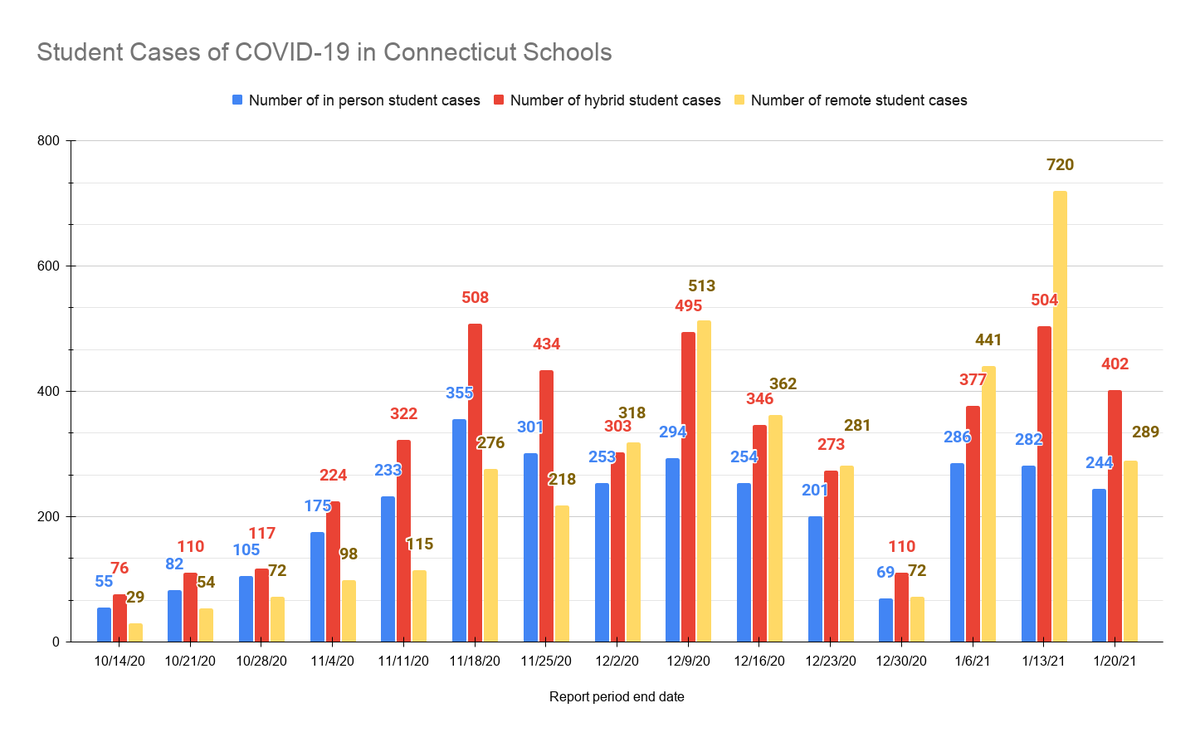
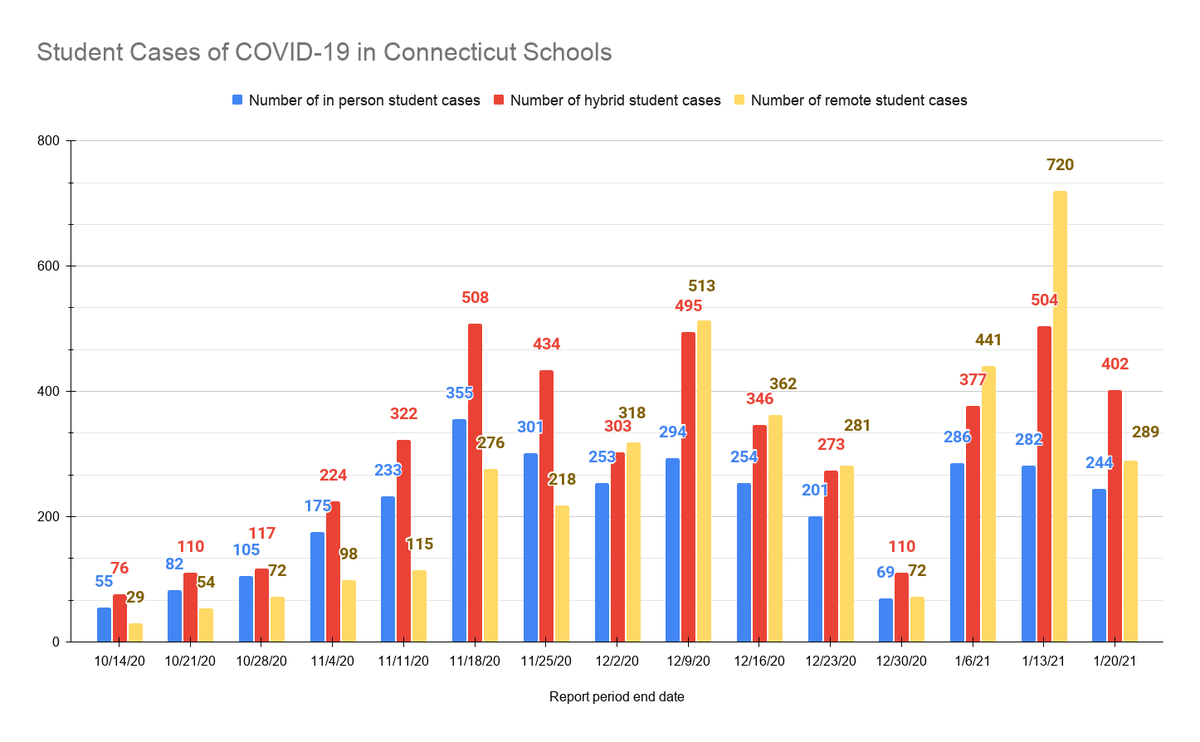
What the media has often reported is each individual type of school (in-person, hybrid, or remote). So you will see data split into three categories. I've made a chart that is similar too. Here's the most recent data in that format...
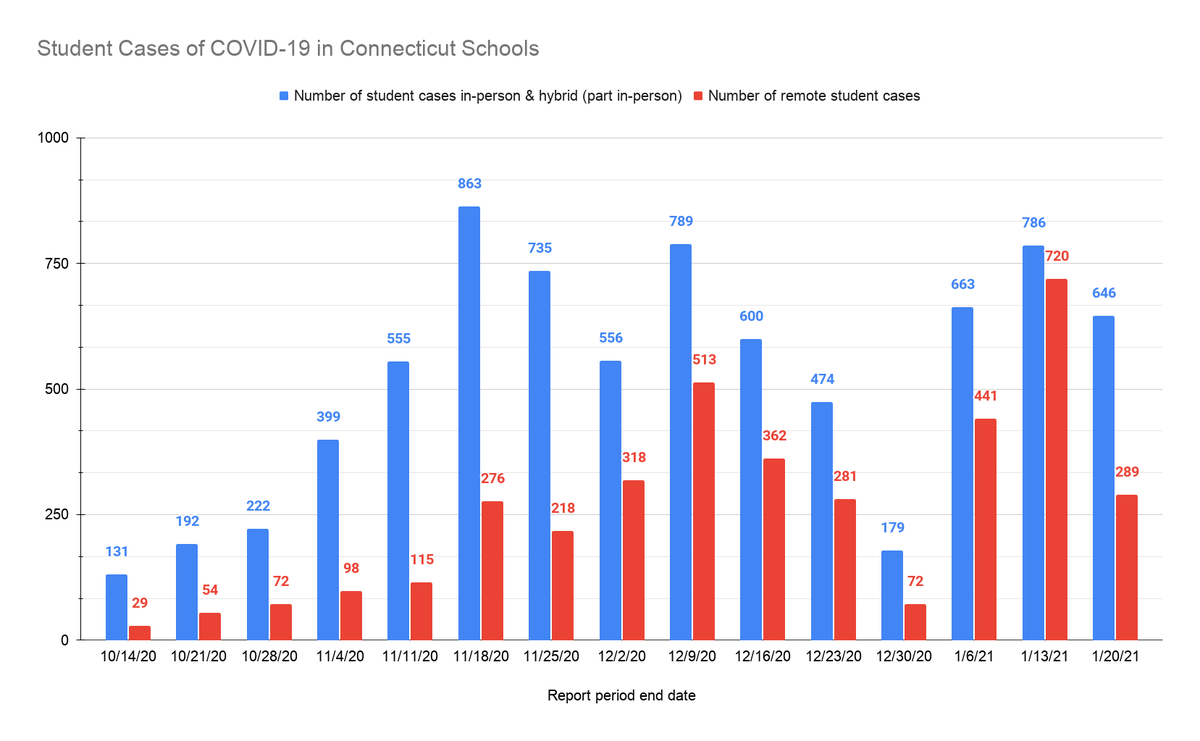
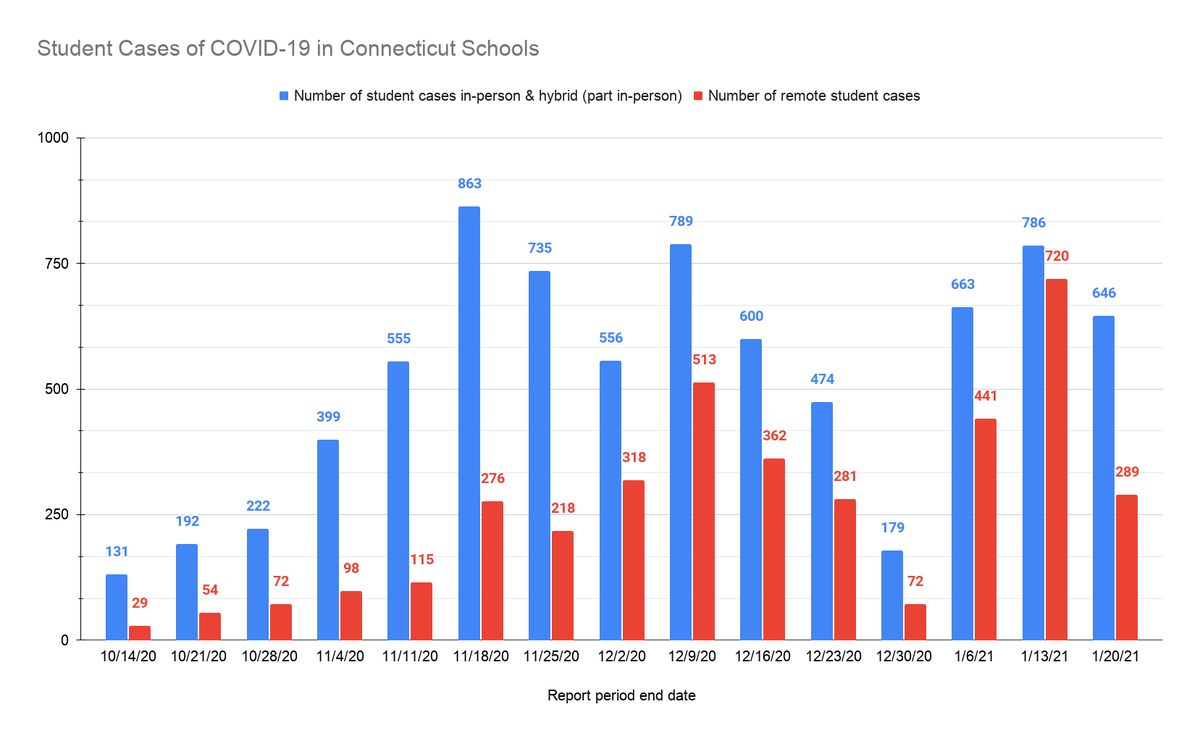
Instead, should we also compare ANY in-person types of school (in-person + hybrid/part in-person) to remote mode? Looking at data in that way shows a major issue: the modes that bring kids into school in-person all week or partial week have the highest number of COVID-19 cases...
While there is need for key data to analyze further, question how past reporting of ONLY each individual category obscures higher numbers of children with COVID-19 at 2 in-person modes combined. This separation also makes remote schooling sometimes appear as higher # of cases...
Finally, this State data does not include denominators. In other words, this data sheet does not include how many students are actually participating in these modes. That is a need for further analysis. But the way we look at this data is important as we look back and forward...
Data source: COVID-19 Cases in CT Public Schools (State Summary)
https://data.ct.gov/Health-and-Human-Services/COVID-19-Cases-in-CT-Public-Schools-State-Summary-/vvjf-9vkr
https://data.ct.gov/Health-and-Human-Services/COVID-19-Cases-in-CT-Public-Schools-State-Summary-/vvjf-9vkr
Forgot to add in the text, but it's in the charts: this data is from the State of Connecticut!

 Read on Twitter


