#Gold Hold & Stay Strong.
A thread.
The two main drivers of #Gold are real yields and M2 money supply.
I want to show you some major bigger cycles, blended in with Elliot Waves and Money Supply.
1
A thread.
The two main drivers of #Gold are real yields and M2 money supply.
I want to show you some major bigger cycles, blended in with Elliot Waves and Money Supply.
1
Look at the 8 year #gold cycle showing a very clear picture.
Our framework suggests 1 or 2major upwaves in #gold cycle, before a retrace
This top would coincidence with an important stock market top, which also asks for a final blow-off
An event driven by M2 money printing
2
Our framework suggests 1 or 2major upwaves in #gold cycle, before a retrace
This top would coincidence with an important stock market top, which also asks for a final blow-off
An event driven by M2 money printing
2
The next gold peak suggests to be important.
Important equals parabolic.
Enforced by EW. (Gold will make a 5 while Silver will make a violent 3 since it bottomed only March 2020)
It's takes a long time and can continue.
Fact is #silver is trading higher as Sept 24
3
Important equals parabolic.
Enforced by EW. (Gold will make a 5 while Silver will make a violent 3 since it bottomed only March 2020)
It's takes a long time and can continue.
Fact is #silver is trading higher as Sept 24
3
At some point this will turn into a long, relentless trending upmove, different from the current environment.
Early profit takers will get punished while we transition INTO violent bull.
Let’s look at M2
4
Early profit takers will get punished while we transition INTO violent bull.
Let’s look at M2
4
M2 is starting to accelerate again after a hell of a ride from March to July, when the #gold price exploded.
From August to November this slowed down.
We know M2 will go hard the coming months.
5
From August to November this slowed down.
We know M2 will go hard the coming months.
5
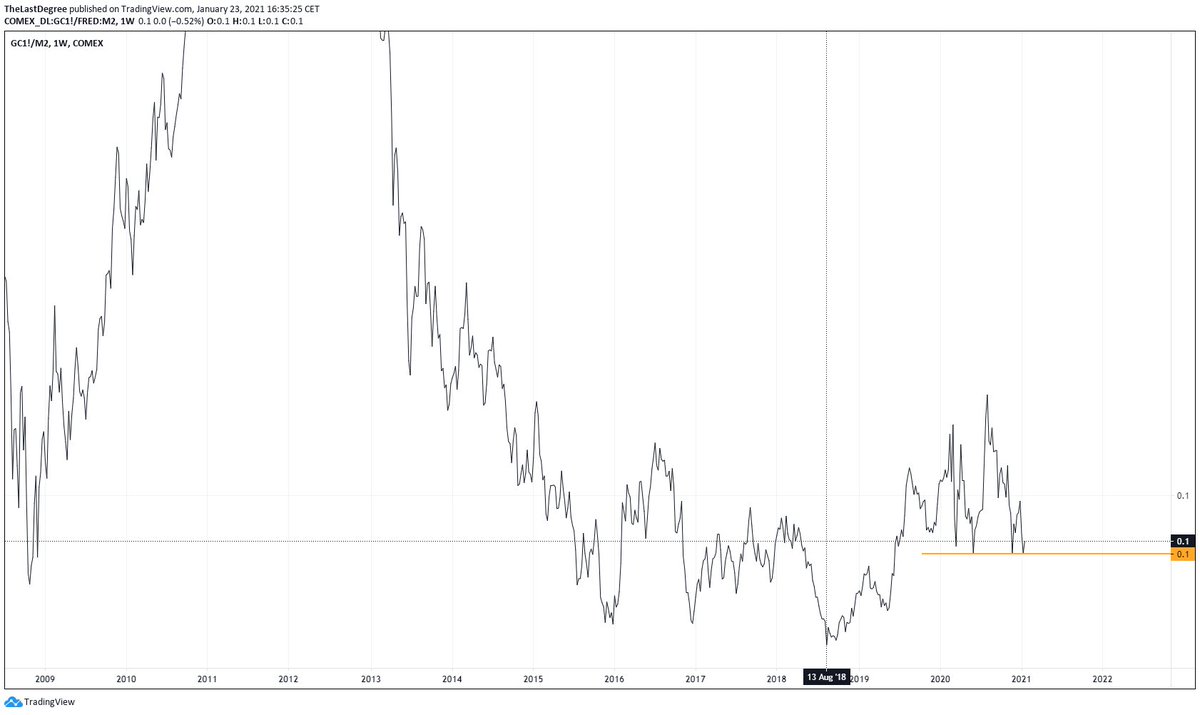
Let’s study the #gold chart devided by the M2 money supply
In full bull mode, #gold starts to frontrun this ratio
We have some very interesting developments here.
First, we are at very strong support... and M2 will run harder coming months
6
In full bull mode, #gold starts to frontrun this ratio
We have some very interesting developments here.
First, we are at very strong support... and M2 will run harder coming months
6
Next, while the Gold/M2 made an undercut this last week, Gold itself made a higher low.
Interesting divergence, smells.
7
Interesting divergence, smells.
7
We had a same strong divergence back in 2007
Now wait: this was the last advance BEFORE the drop into th e 8y cycle low.
Which has been coming like clockwork
Here is the setup of 2007:
8
Now wait: this was the last advance BEFORE the drop into th e 8y cycle low.
Which has been coming like clockwork
Here is the setup of 2007:
8
This converges with $GDX and $SLV reaching both all time highs in the next 6-12 months, and after that they start working on a handle
A correction after a parabolic wave, (dollar relief rally + stock market correction) Timeframe: start in the next 9-12 months.
the GDX handle
9
A correction after a parabolic wave, (dollar relief rally + stock market correction) Timeframe: start in the next 9-12 months.
the GDX handle
9
If we apply something similar here, we get $2850 gold by October (depending on where this consolidation ends), with a halfway correction pattern
(so 2 intermediate cycles advancing)
11
(so 2 intermediate cycles advancing)
11
The #gold to M2 ratio is exact the same start level here as back then.
Now we all know M2 is starting to accelerate at a very fast pace here under the Biden administration.
i saw assumptions going into many many trillions.
Gold/M2:
12
Now we all know M2 is starting to accelerate at a very fast pace here under the Biden administration.
i saw assumptions going into many many trillions.
Gold/M2:
12
We can use history as a guide, but it’s the clear the biggest risk is to the Upside.
By showing a clear support and path my message is clear
Sit this consolidation until it triggers to the upside.
13
By showing a clear support and path my message is clear
Sit this consolidation until it triggers to the upside.
13
Don’t for get that $GDXJ chart.
It’s a trade you get once or twice in your lifetime in the metals.
a breakout above a 7y base. backtesting. what happens after isa generational trade
14
It’s a trade you get once or twice in your lifetime in the metals.
a breakout above a 7y base. backtesting. what happens after isa generational trade
14
Or that Barrick Gold miner compared to Gold metal chart.
Miners have never been this cheap in history.
Stay strong! We aberely started.
15
Miners have never been this cheap in history.
Stay strong! We aberely started.
15

 Read on Twitter


