THREAD: Flooding has been the deadliest thunderstorm-related hazard in the United States over the past three decades. The following tweets contain several maps that highlight some statistics related to flooding fatalities and rainfall.
This map shows the average number of flood-related deaths per year in all U.S. states. This is based on the following official Storm Data types over the past ~25 years: flood, flash flood, heavy rain, and debris flow.
Normalizing flood-related deaths by the geographic area of U.S. states yields this map: average number of fatalities in the past ~25 years per 10,000km². The states with the highest concentration extend from the Arklatex and Ozarks regions into the Ohio Valley and Mid Atlantic.
This is a heat map showing the locations of all flood-related fatality events over the past ~25 years. The greatest concentrations on a more localized level are in Texas, in a region commonly referred to as "Flash Flood Alley," including much of the I-35 corridor.
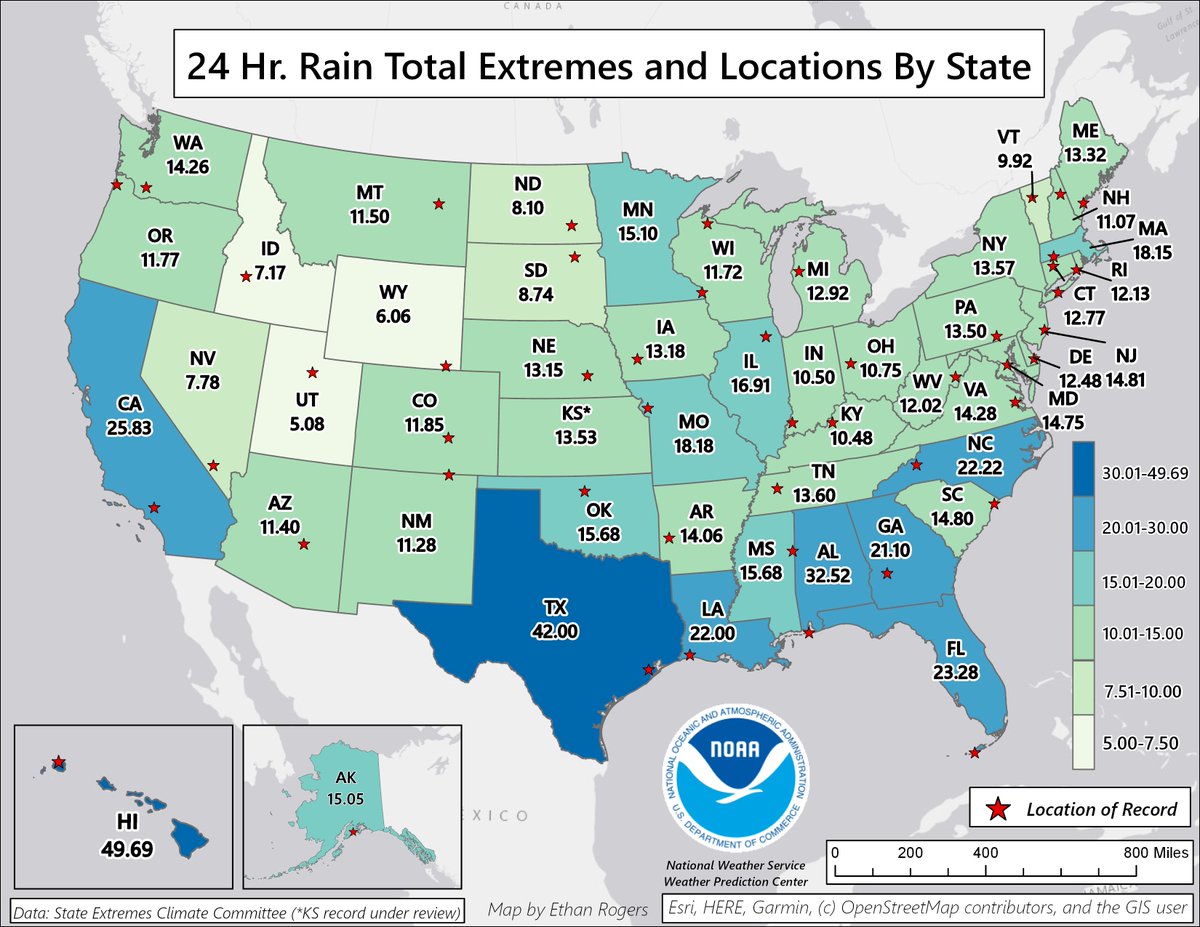
And this is a map showing the record 24-hour rainfall amounts and locations for each U.S. state, based on the database maintained by @NOAANCEIclimate here: https://www.ncdc.noaa.gov/extremes/scec/records
The highest value of nearly 50 inches in 24hr was set in Hawaii just two years ago in April 2018.
The highest value of nearly 50 inches in 24hr was set in Hawaii just two years ago in April 2018.
For the latest information on rainfall-related hazards over the next few days, please see our Excessive Rainfall Outlooks. The initial outlooks are usually available by around 4 AM Eastern each morning, and are updated later in the day. https://www.wpc.ncep.noaa.gov/qpf/excess_rain.shtml
Thank you to one of our 2020 Lapenta Student Interns, Ethan Rogers, for developing the maps and underlying database that you saw in this thread.

 Read on Twitter


