 New work!
It's the official
 German
  COVID-19 Vaccination
  Dashboard
 https://impfdashboard.de
for @BMG @RKI_de
with @studioNAND @cosmonautskings
 A few thoughts on design/tech:
(First of all, the site is in German language, but it should hopefully translate OK in the automatic website translator of your choice.)
Our primary goal is to present the most important official vaccination statistics in a concise, appealing and widely accessible way.
We designed the site mobile first — a good call, given that two thirds of our visitors up to now were, in fact, mobile users.
We designed the site mobile first — a good call, given that two thirds of our visitors up to now were, in fact, mobile users.
This lead us away from the typical "chart patchwork" found on many other dashboards towards a responsive , content and communication oriented approach.
Consequently, we rely not only charts or tables to convey information, but also a lot on text, generated from data.
Consequently, we rely not only charts or tables to convey information, but also a lot on text, generated from data.
Compared to a chart, text generated from data is…
- lower barrier
- screenreader-friendly
- easily shareable by copy-paste
- automatically translatable
- ...
So, it's the perfect complement to a visual #dataviz element — and in addition, can eliminate the need for a legend!
- lower barrier
- screenreader-friendly
- easily shareable by copy-paste
- automatically translatable
- ...
So, it's the perfect complement to a visual #dataviz element — and in addition, can eliminate the need for a legend!

We also make sure to present the most important facts in different forms — for instance, the bar chart on top shows how yesterday's vaccination rate compared to the last seven days …
…while the "vaccination clock" further below provides you an intuitive feeling how fast the pace of vaccination is in Germany, currently.
Same data, different perspectives, different insights.
Same data, different perspectives, different insights.
BTW — the clock has received a bit of criticism (too gimmicky, or too celebratory of still slow rates), but that was to be expected 
We do think it provides a helpful, alternative, human-scale sense of the pace of vaccinations.

We do think it provides a helpful, alternative, human-scale sense of the pace of vaccinations.
(And if you prefer the naked numbers, we provide those, too.)
The road to full vaccination is a long one, so we thought about how we can define intermediate goals. Our milestones section celebrates those achievements, (obviously inspired by badges in video games), and could provide meaningful anchors in a timeline view.
Accessibility is a key concern, too.
We made sure
- all elements have good color contrasts and minimum sizes,
- a prefersReducedMotion setting turns off animations by default
- and all key information is presented through multiple channels.
We continue work in this area!
We made sure
- all elements have good color contrasts and minimum sizes,
- a prefersReducedMotion setting turns off animations by default
- and all key information is presented through multiple channels.
We continue work in this area!
Another cool tech fact:
Social media preview images, embeddable views on our partner site https://zusammengegencorona.de —and even the favicon! — are generated as static images on each deployment, from current data, using puppeteer ( https://pptr.dev ).
Social media preview images, embeddable views on our partner site https://zusammengegencorona.de —and even the favicon! — are generated as static images on each deployment, from current data, using puppeteer ( https://pptr.dev ).
So the twitter preview you see when linking the site shows actually the latest data! 

https://impfdashboard.de
#detailsmatter


https://impfdashboard.de
#detailsmatter
(Also, don't tell anyone, but we even use puppeteer to generate our static sites, like the imprint, from javascript code #advancedmacgyvering)
Finally, this is all work in progress!
We update the site every day with new data and fixes, sometimes extensions — and there is, in fact, a long term plan when we'll introduce bigger new features.
We update the site every day with new data and fixes, sometimes extensions — and there is, in fact, a long term plan when we'll introduce bigger new features.
This might be unexpected for folks who expect an official dashboard like this to be a monolithic single release — but in our experience, figuring this out in the open is key for user-centeredness.
We learned a lot already in the week that it has been online and received tons of great questions and suggestions.
Summing up: although we were brought in as #dataviz experts, we opted not to impress with "fancy charts", but first and foremost to get the basics right, in terms of
- effective communication
- wide accessibility and
- practical use of the data
We hope it paid off
- effective communication
- wide accessibility and
- practical use of the data
We hope it paid off

Here's the link to the site again:
https://impfdashboard.de
Thanks to everyone involved, especially @stphnthiel @steffen_fiedler @fabianehmel Judith Glaser @jonas_loh @lennart_k
Let us know what you think and how we can improve!
https://impfdashboard.de
Thanks to everyone involved, especially @stphnthiel @steffen_fiedler @fabianehmel Judith Glaser @jonas_loh @lennart_k
Let us know what you think and how we can improve!
OK, forgot some shout-outs.
Thanks to
- @propublica for the weepeople icons ( https://github.com/propublica/weepeople)
- @sveltejs for making development of dynamic sites like this a breeze
- @JanWillemTulp for (maybe, minimally ) inspiring the vaccination clocks https://covidspreadingrates.org

Thanks to
- @propublica for the
 weepeople icons ( https://github.com/propublica/weepeople)
- @sveltejs for making development of dynamic sites like this a breeze
- @JanWillemTulp for (maybe, minimally
 ) inspiring the vaccination clocks https://covidspreadingrates.org
http://impfdashboard.de update:
Added timelines for persons vaccinated and doses administered — both split by first and second dose.
Added timelines for persons vaccinated and doses administered — both split by first and second dose.
Neat design detail: on mobile, we reveal detail values with an external slider, so you don't occlude the chart while interacting.
http://impfdashboard.de update:
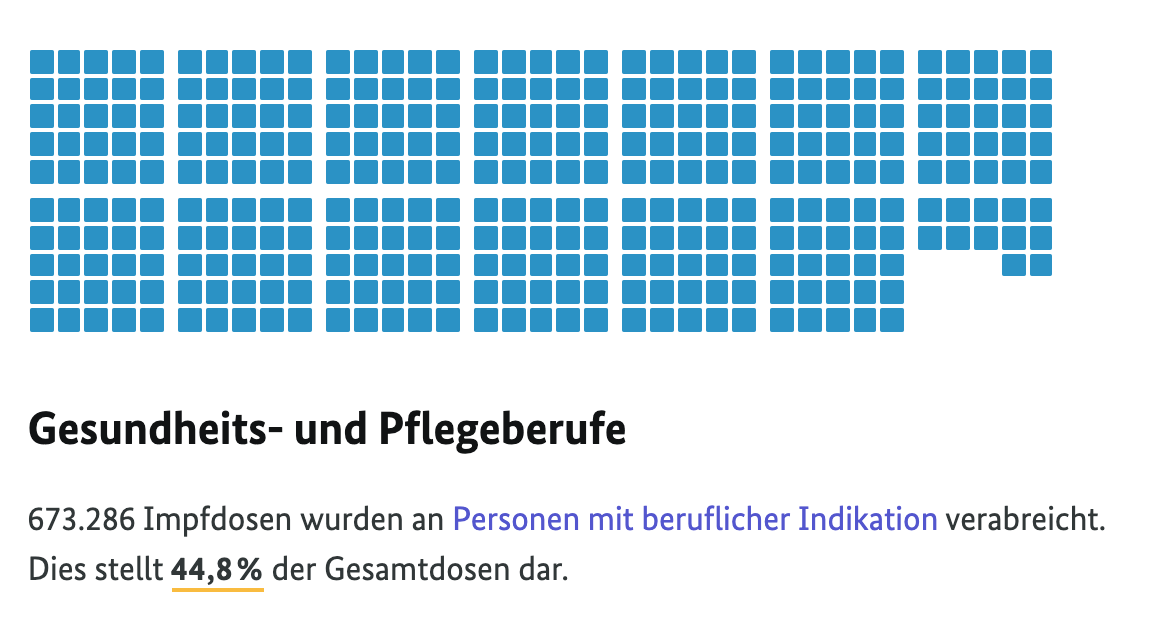
We now differentiate between first and second vaccinations in the priority groups.
We now differentiate between first and second vaccinations in the priority groups.
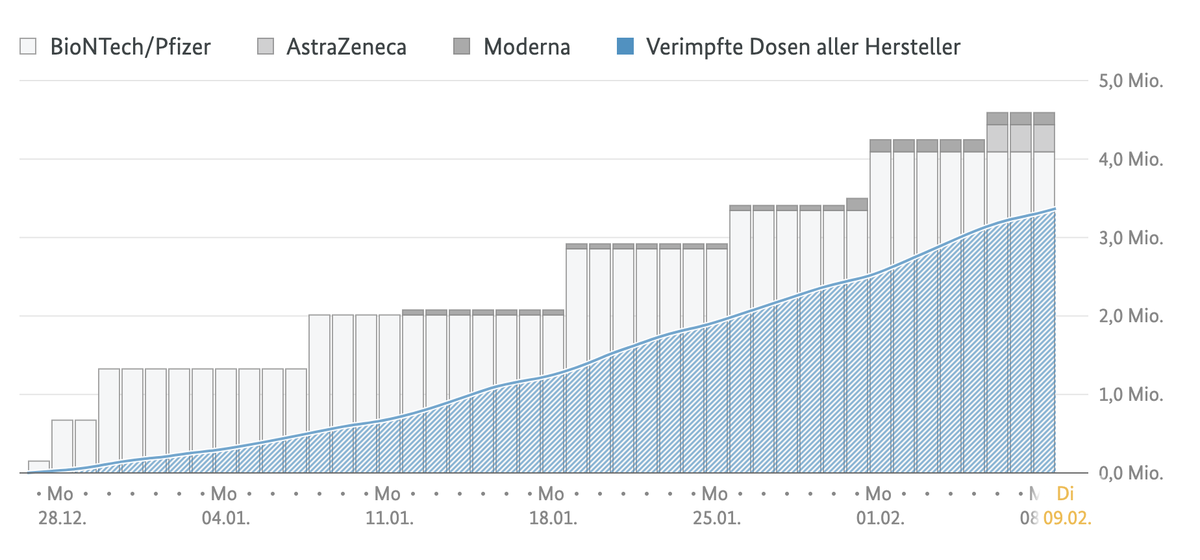
And, http://impfdashboard.de also shows vaccine deliveries now, and how much of them have been used over time.

 Read on Twitter


