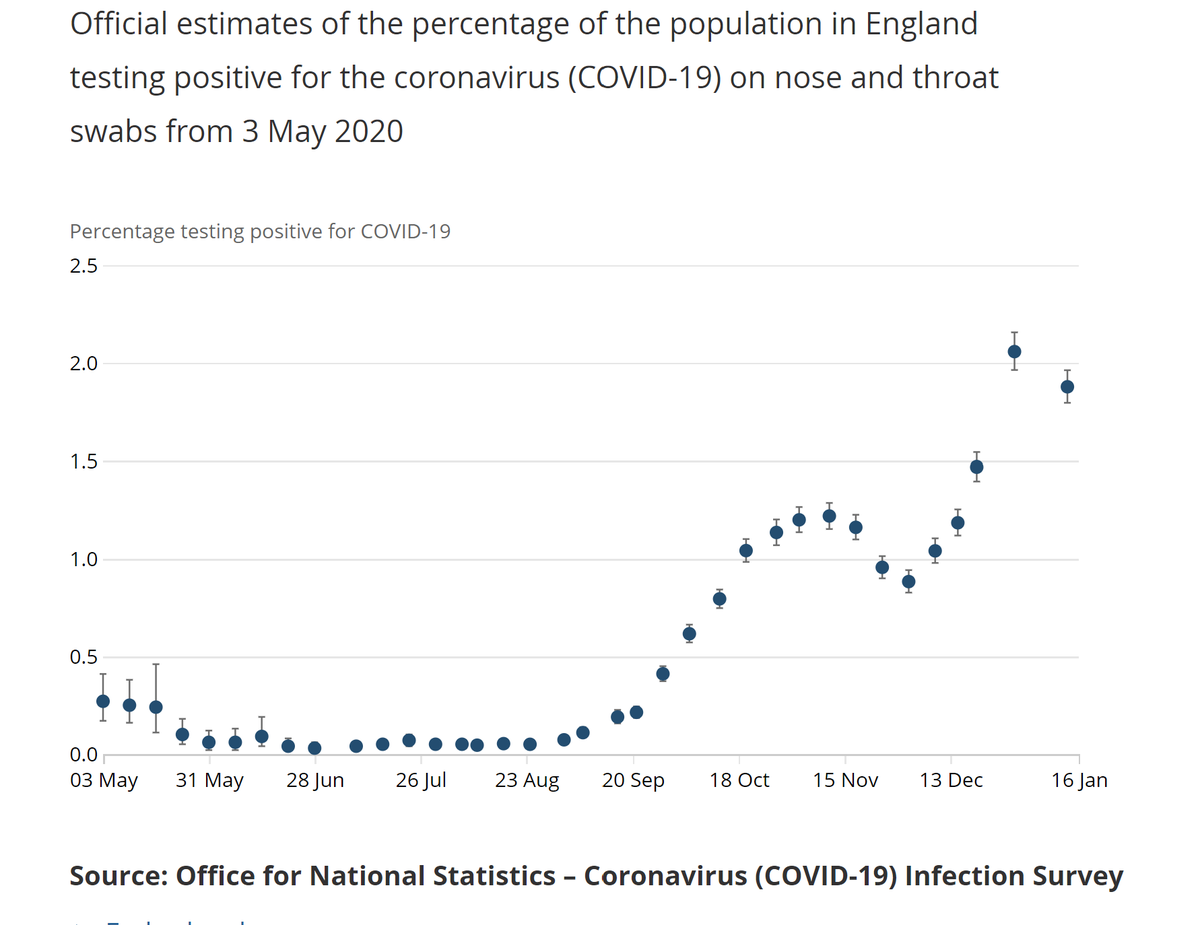
The @ONS survey on infectivity is back after missing last week due to data quality issues. It suggests a small decrease across England, with 1.88% of the community population being infected, still just over 1m people, or 1 in 55. This data runs to Jan 16.
A short thread... 1/10
A short thread... 1/10
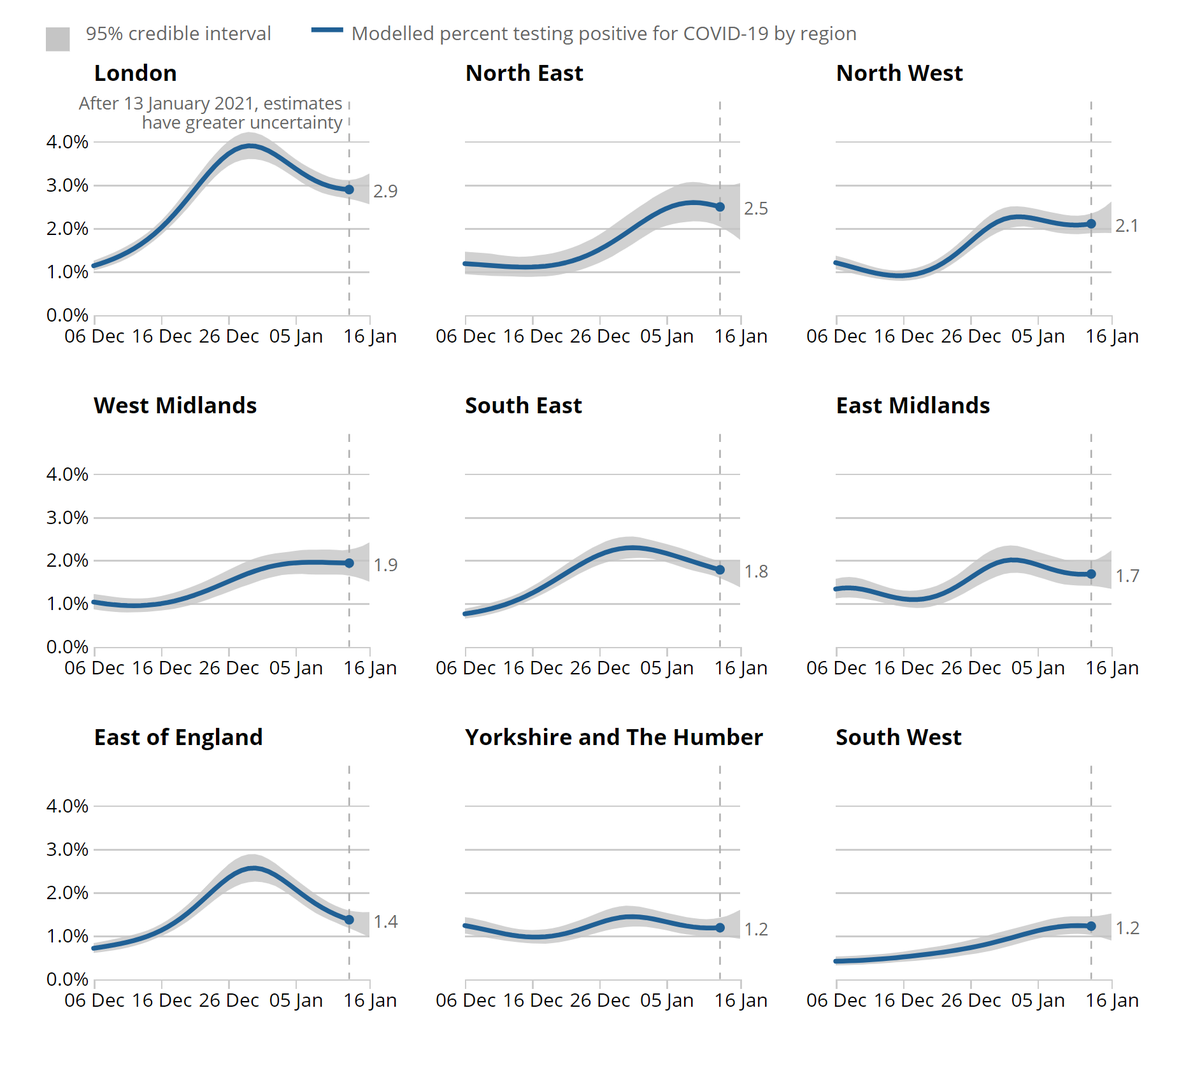
Regionally, London stands out at having reached almost 4% at peak infectivity, but is now declining. It's still the highest though.
Notable falls elsewhere in the SE and East, but other regions are more mixed and much less certain as to current direction.
2/10
Notable falls elsewhere in the SE and East, but other regions are more mixed and much less certain as to current direction.
2/10
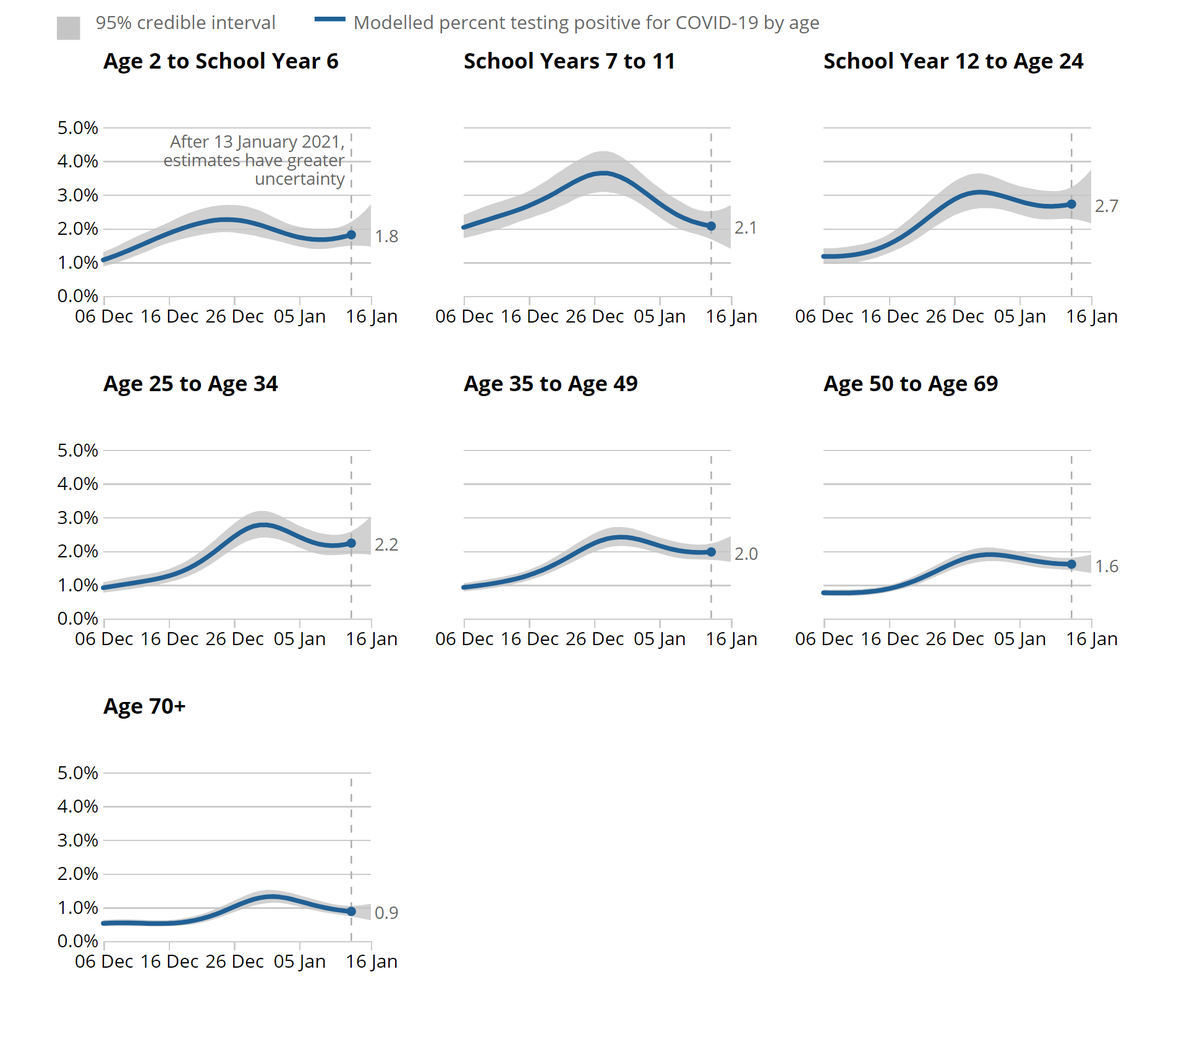
By age it's good to see modest falls in the oldest most vulnerable groups. Elsewhere, working age adults appears to have levelled off after a fall, and there's a variable picture amongst school age groups.
Nice addition of the latest values, helps clarity - thanks @ONS!
3/10
Nice addition of the latest values, helps clarity - thanks @ONS!
3/10
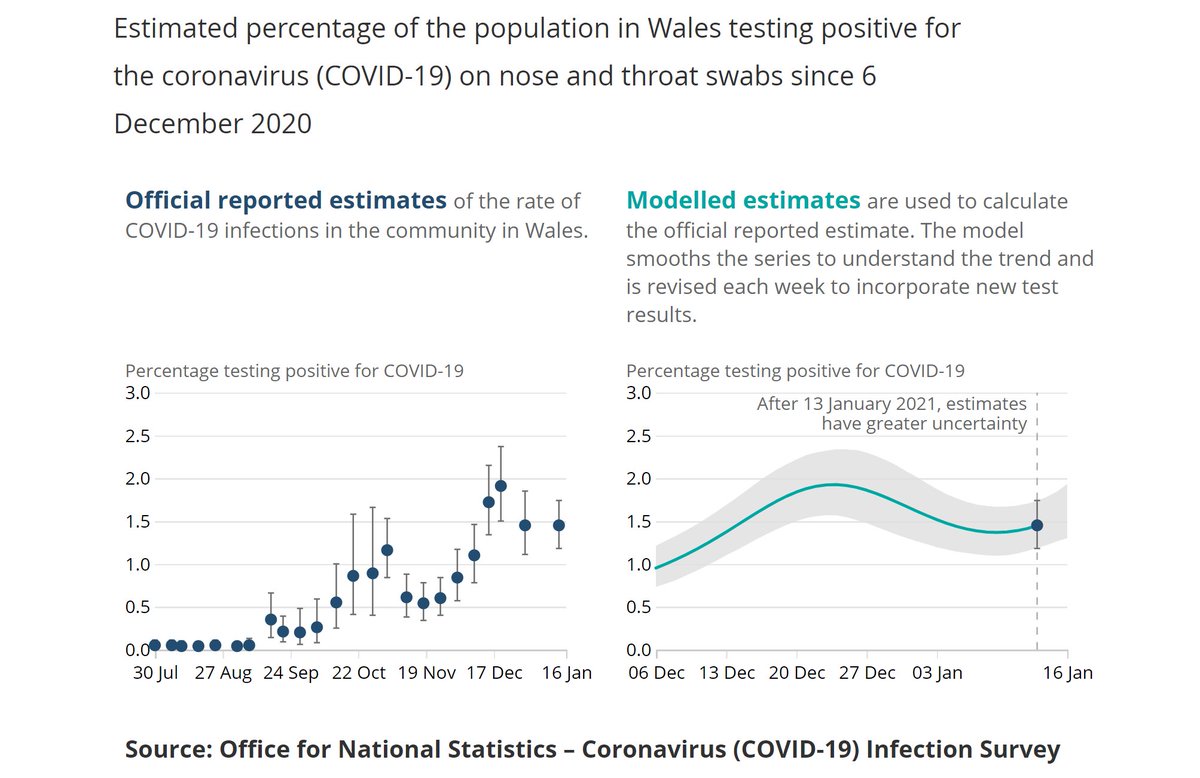
Turning to the devolved administrations (DA's), Wales infectivity is put at 1.45%. This appears broadly level in recent weeks after the December peak.
Note that confidence intervals (CIs) are wider for the DA's, as the sampling sizes are lower though.
4/10
Note that confidence intervals (CIs) are wider for the DA's, as the sampling sizes are lower though.
4/10
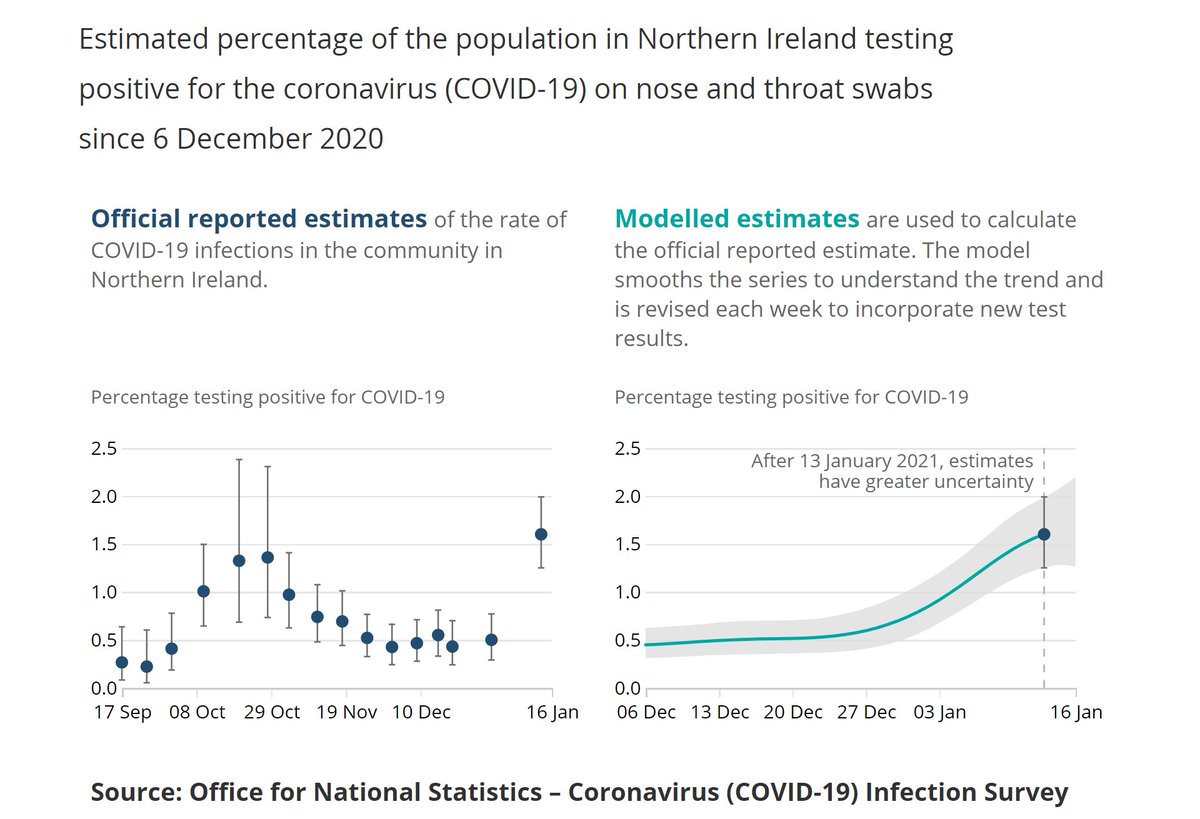
In contrast, Northern Ireland appears to be increasing, after a relatively level period, with the latest estimate at 1.60%. There's a clue why later.
The latest point seems somewhat concerning taken in isolation, but again the CI's need to be taken into consideration.
5/10
The latest point seems somewhat concerning taken in isolation, but again the CI's need to be taken into consideration.
5/10
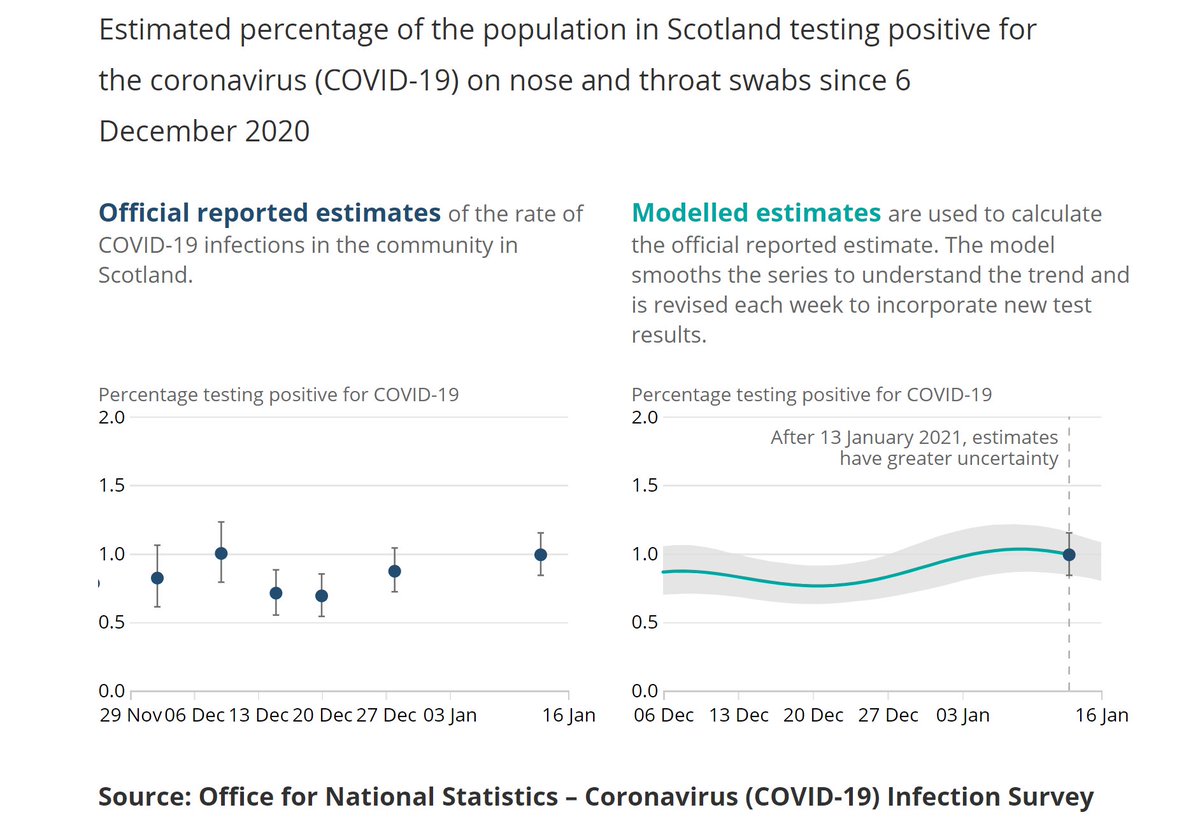
Scotland continues to display a very consistent level, with the latest put at 0.99%. It still looks as though you could draw a level straight line through all the CI bars on the left chart.
6/10
6/10
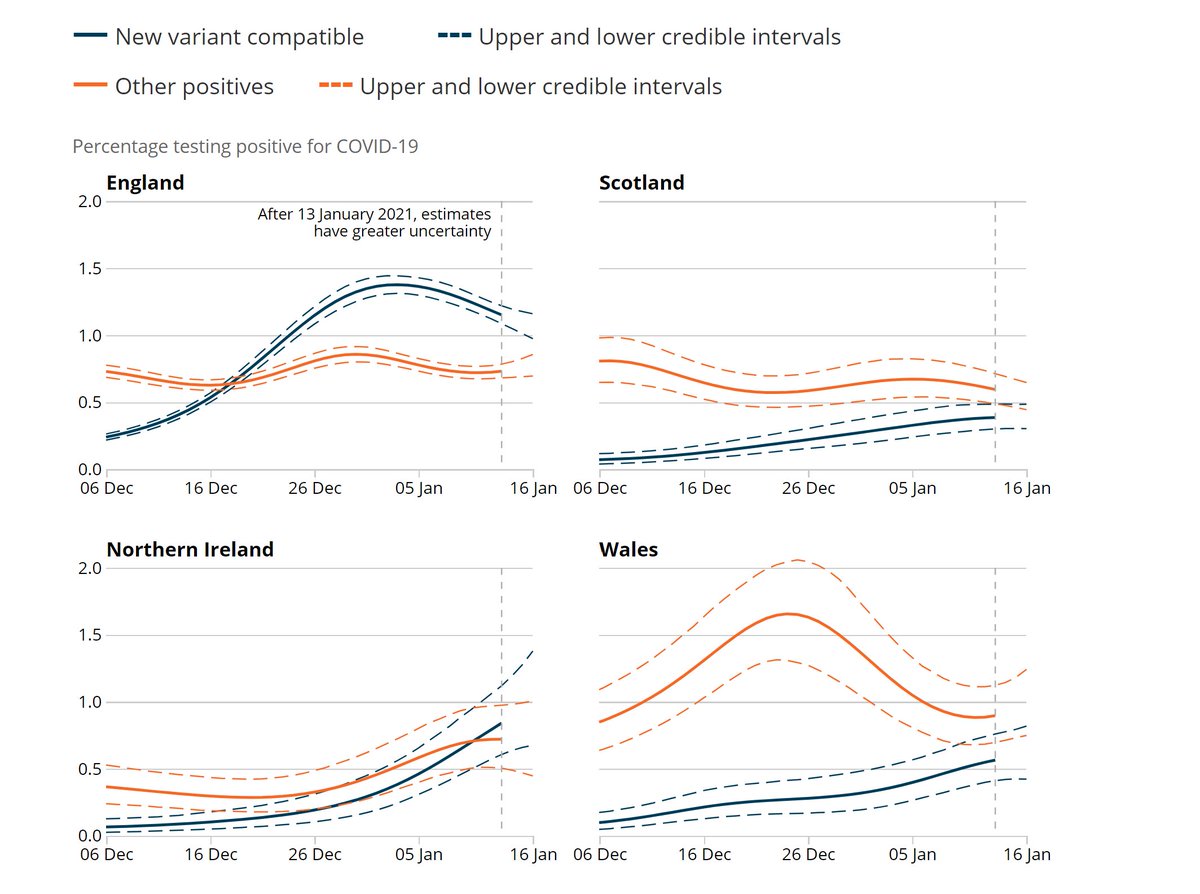
Next some useful data on the new variant. Now on the decline in England, though it's increasing in the devolved admin's. In particular it's increased rapidly in NI recently, and has now overtaken the "classic" variant, which will likely explain the rise seen earlier.
7/10
7/10
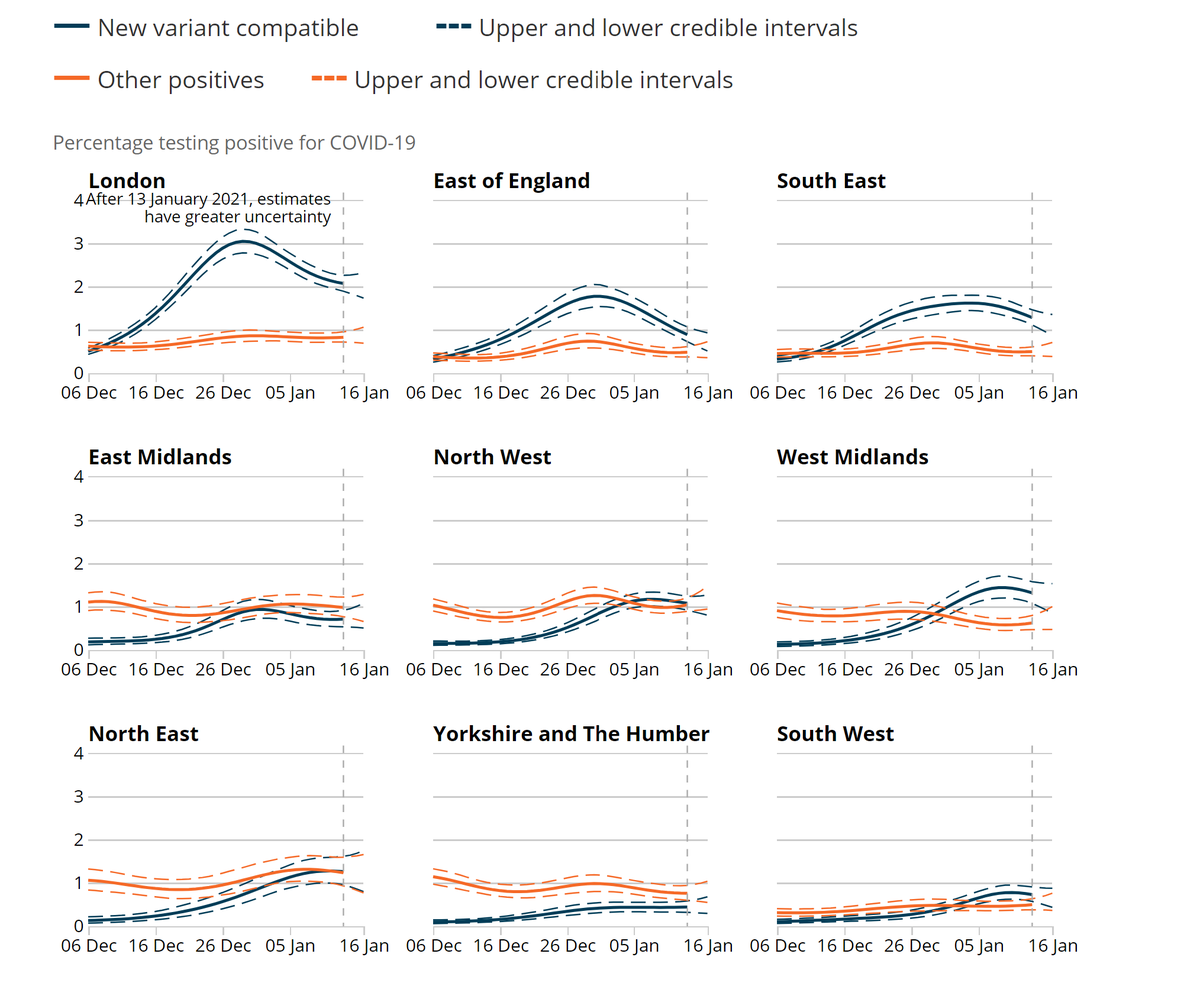
The final chart shows the regional analysis of the new variant.
The top three clearly show the rapid increase until late Dec and similarly paced decline since. Elsewhere, the W Midlands is notable for having picked up in early Jan with more steady growth in the NW and NE.
8/10
The top three clearly show the rapid increase until late Dec and similarly paced decline since. Elsewhere, the W Midlands is notable for having picked up in early Jan with more steady growth in the NW and NE.
8/10
One contrast with yesterday's similar #REACT survey, which ran from Jan 6th to 15th, is that ONS is suggesting a gradual fall over the period, whereas REACT could discern no fall, and possibly even an increase (albeit with a lower absolute level of 1.58%).
9/10
9/10
The survey involved 493,809 randomly sampled tests over the latest 6 week period, of which 7,910 were positive. A continuing massive exercise, for which many thanks to participants, @ONS, and all its partner bodies, shown below.
Report here: https://www.ons.gov.uk/peoplepopulationandcommunity/healthandsocialcare/conditionsanddiseases/bulletins/coronaviruscovid19infectionsurveypilot/22january2021
10/10 END
Report here: https://www.ons.gov.uk/peoplepopulationandcommunity/healthandsocialcare/conditionsanddiseases/bulletins/coronaviruscovid19infectionsurveypilot/22january2021
10/10 END

 Read on Twitter