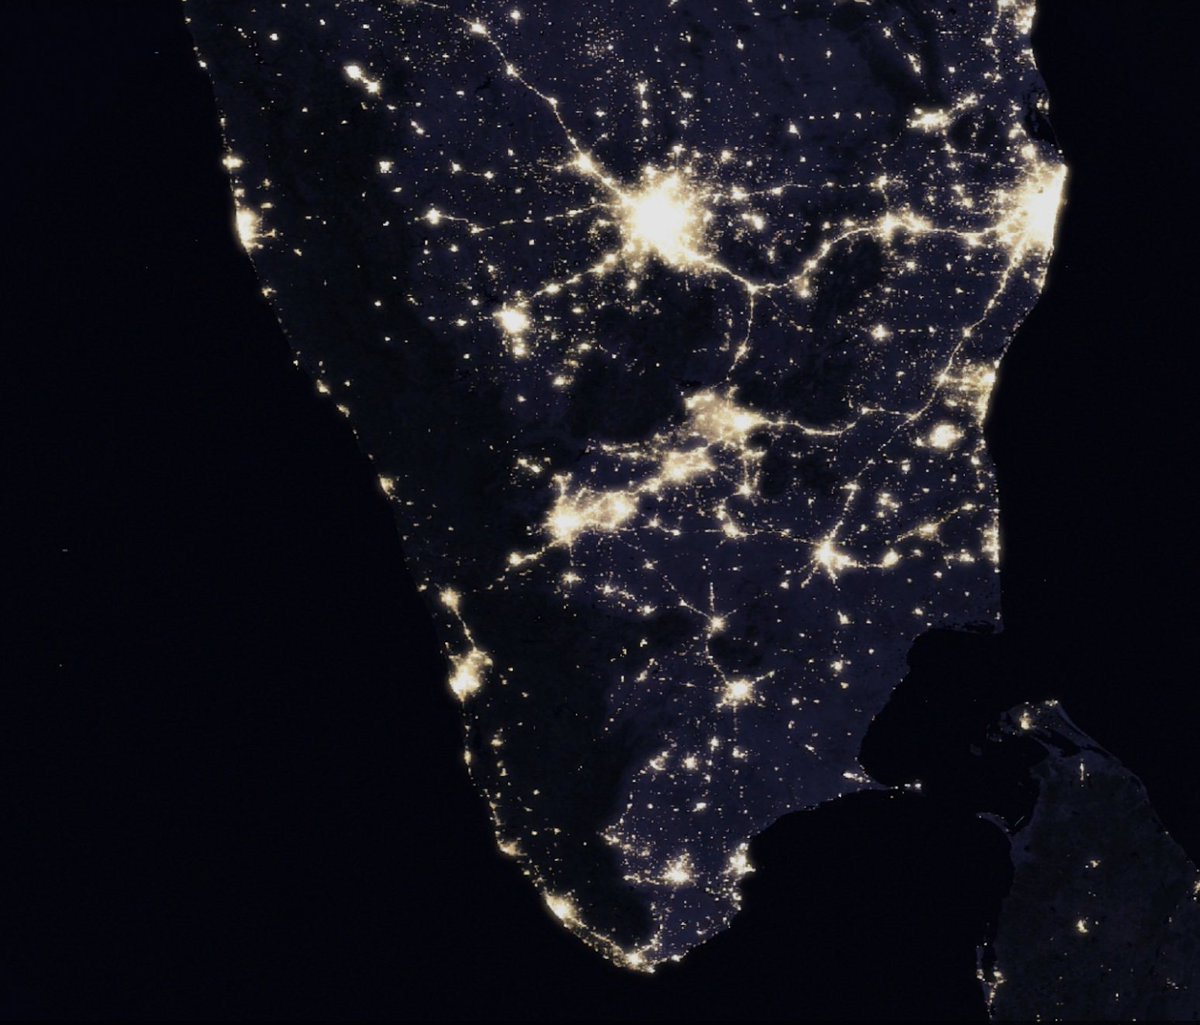
Are night lights (NL) a reliable proxy for local GDP?
An answer, in our paper “Development Research at High Geographic Resolution” aka the SHRUG paper (forthcoming at WBER). 1/14
1/14
TL;DR: don’t trust existing GDP elasticities. With @paulnovosad @tobiaslunt @ryu_matsuura
An answer, in our paper “Development Research at High Geographic Resolution” aka the SHRUG paper (forthcoming at WBER).
 1/14
1/14TL;DR: don’t trust existing GDP elasticities. With @paulnovosad @tobiaslunt @ryu_matsuura
This paper describes the SHRUG, our open data platform covering 600,000 villages, 8000 towns, 5000 constituencies across 30 years in India.
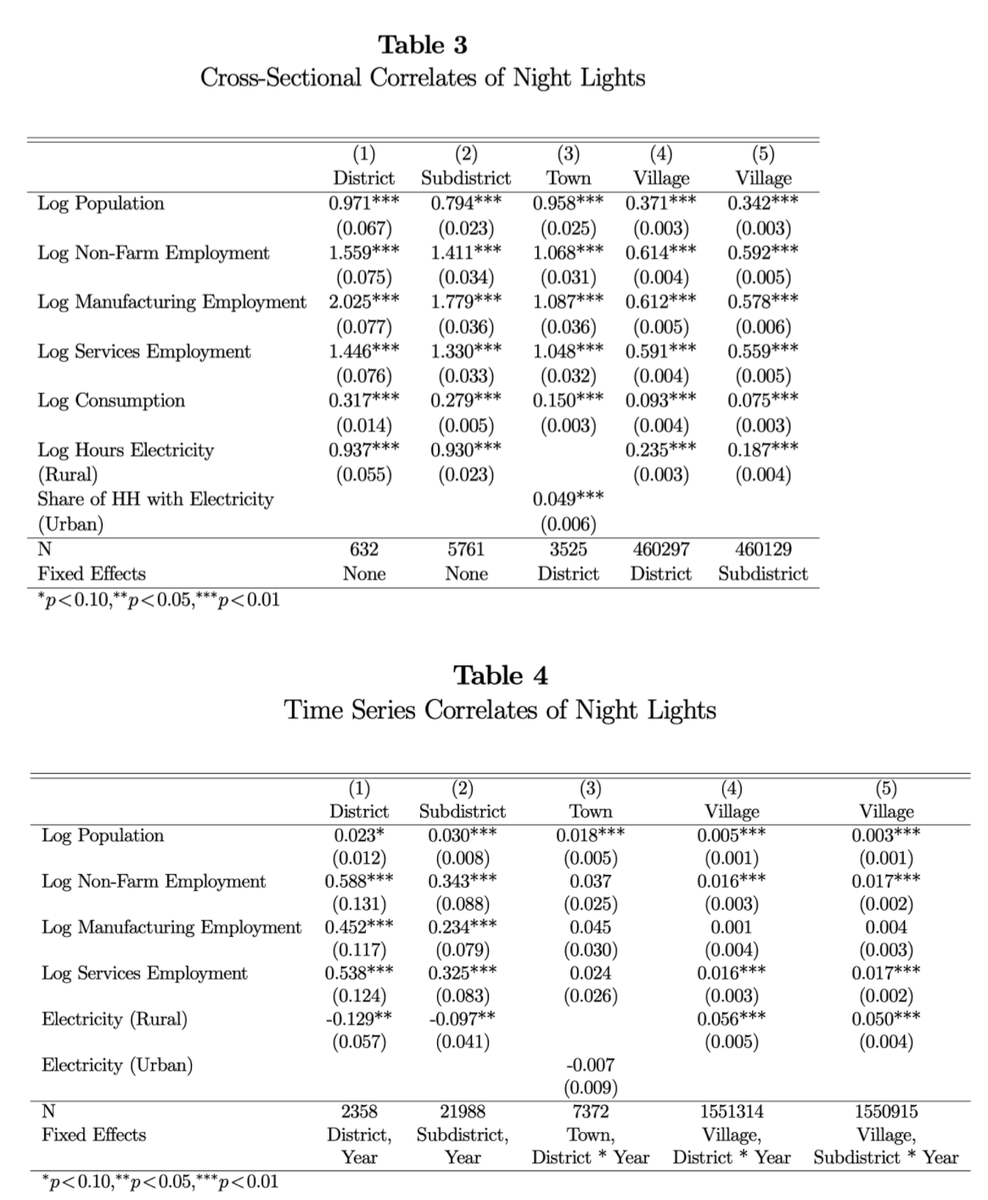
We link NL to high-res data on electrification, per cap consumption, employment, and population. Which of these drive NL? 2/14
We link NL to high-res data on electrification, per cap consumption, employment, and population. Which of these drive NL? 2/14
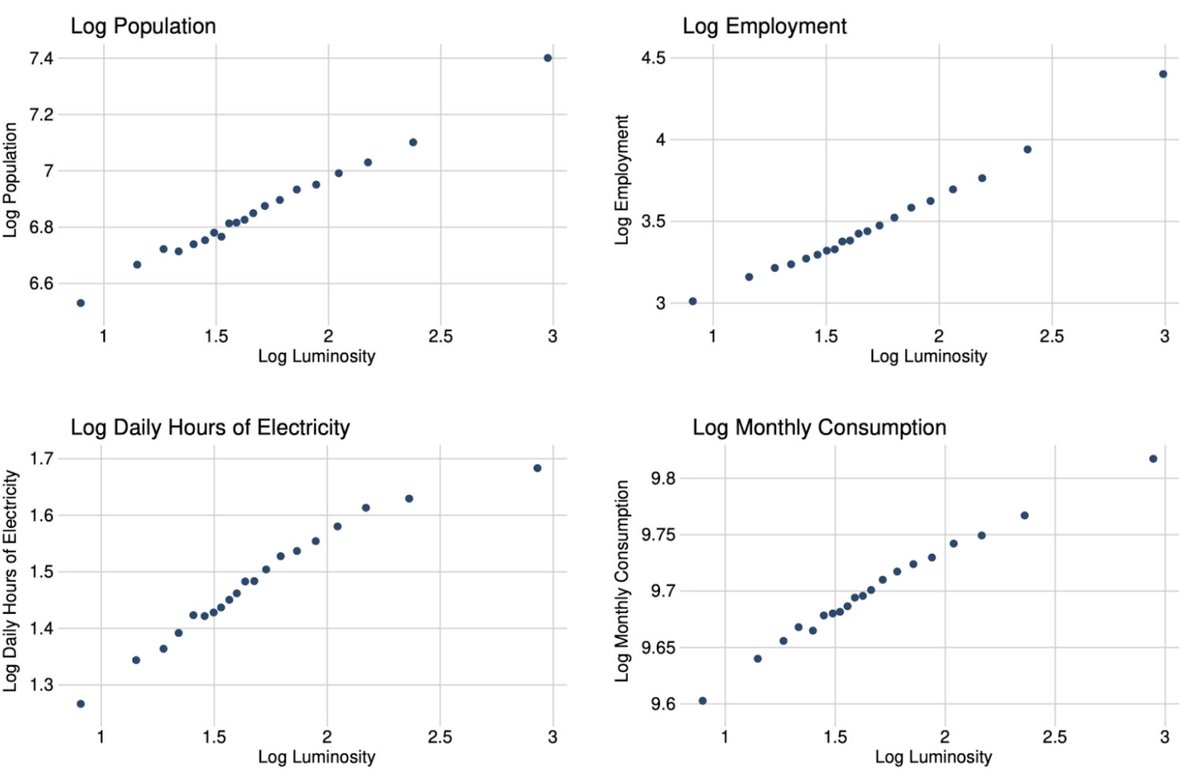
The answer is ALL OF THEM. All these variables are highly correlated with light emissions across the full distribution of luminosity, even at highly local levels. 3/14
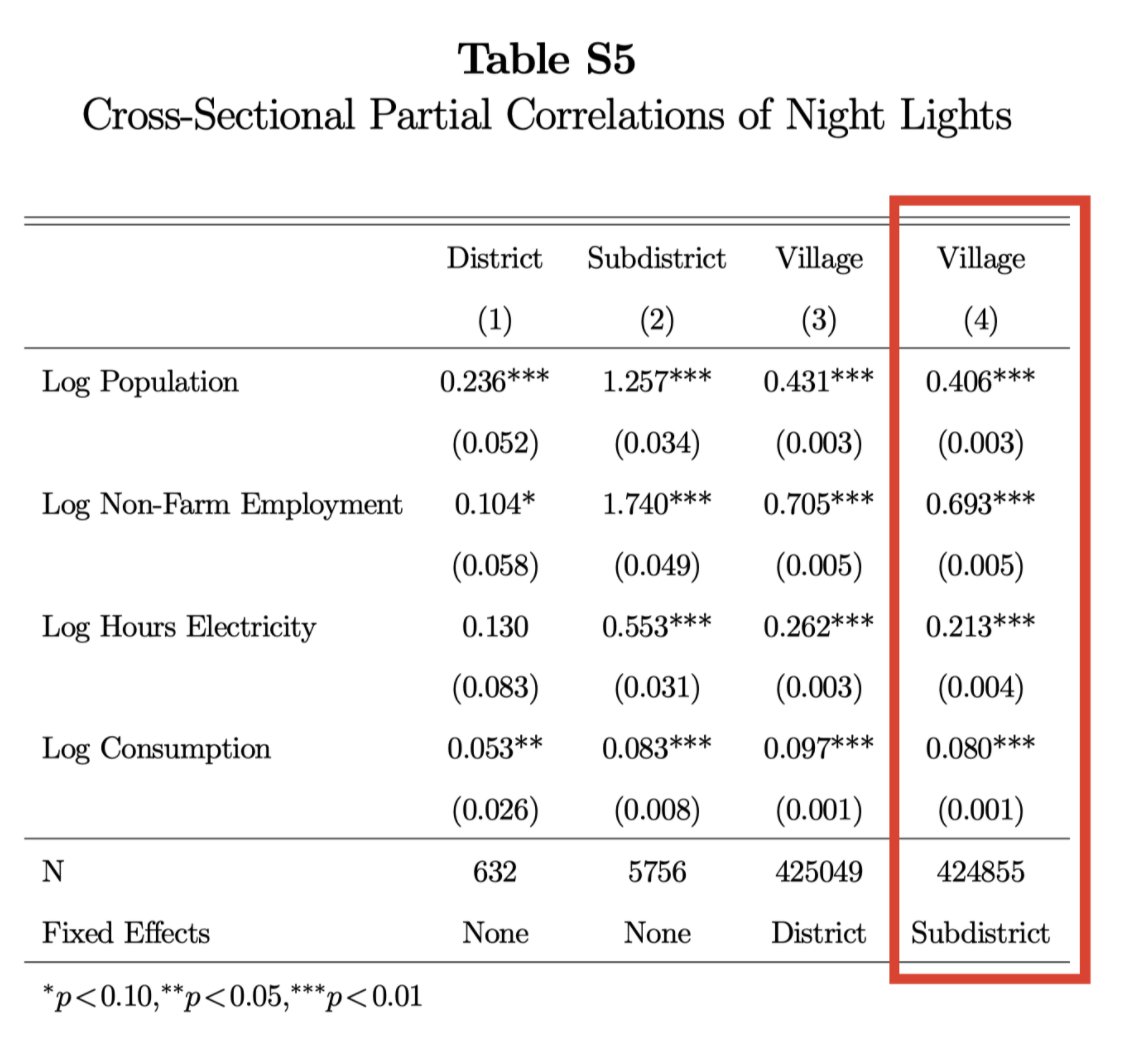
This is true even after controlling for all the other variables, and after controlling for subdistrict fixed effects, i.e. even within sets of 100 villages, night lights are predictive of all these variables in the cross-section. 4/14
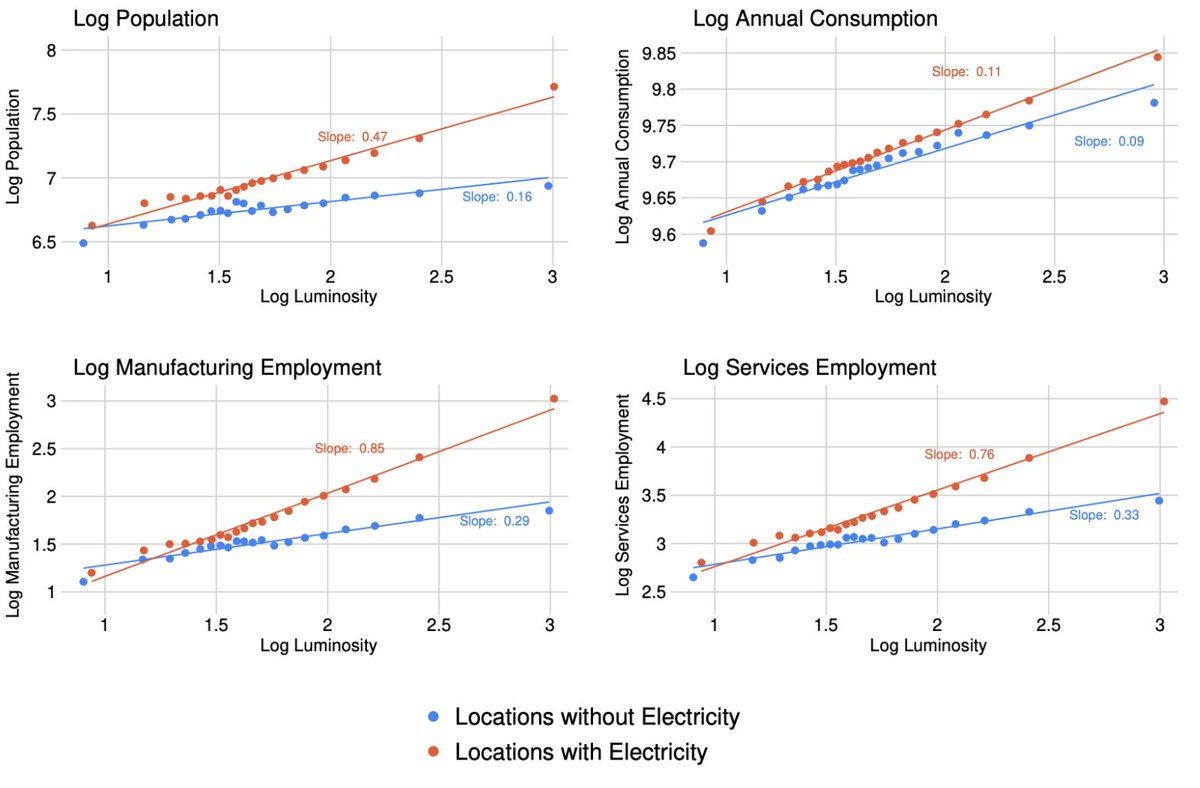
The elasticities vary a lot based on other place characteristics too. We find a much higher night light elasticity for all the variables in places that are electrified. 5/14
This is a problem for researchers applying a lights-to-GDP elasticity from the literature. You don’t know what night lights represent. In one context they could proxy electrification; in another, population or GDP. And the elasticities change across space. 6/14
At least all these things are good — night lights are clearly a very good cross-sectional proxy for local development interpreted as a basket of goods, even if we don’t know exactly what is in the basket.
But what about the time series? 7/14
7/14
But what about the time series?
 7/14
7/14
The news here is not so good for night light users. Time series elasticities (Table 4) are less than 1/20th the size of cross-sectional elasticities (Table 3). Take rural employment: X-section elasticity is 0.59; time series is 0.02. 8/14
In other words: if you are using night lights in time series, with place fixed effects (the most common use case!), you might be massively overestimating the impacts on GDP. 9/14
There is a common practice in econ papers using data like these — show a high x-section elasticity, and then use it to interpret a time series. But we’ve found again and again that time series prediction is just much harder. 10/14
Night lights are still great! They are a great multi-dimensional development measure available with high resolution and in places with no other data. But you should know what you’re measuring. Don’t just assume a fixed light:GDP elasticity. 11/14
Caveat: this is all using DMSP night lights which run from 1994–2013. The new VIIRS might be better, but our guess is there’s still a big difference between cross-section and time series elasticity. 12/14
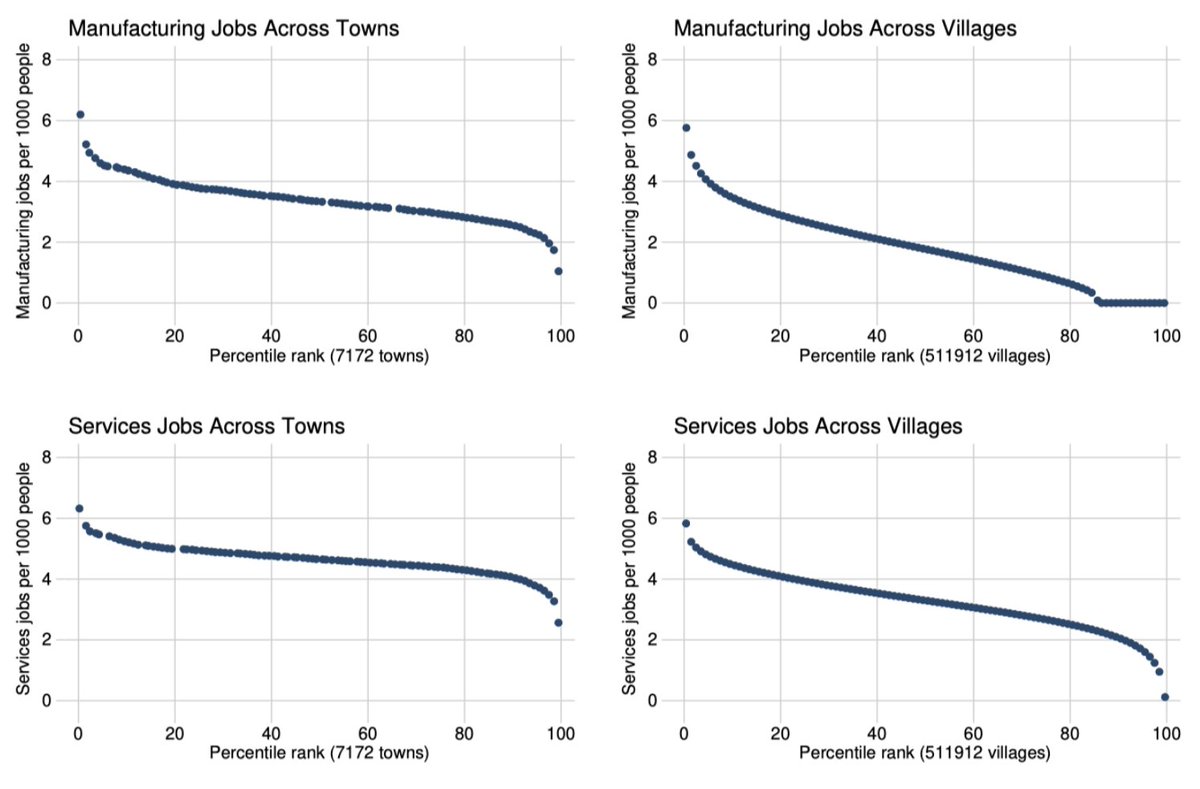
We highlight a few other types of analyses that can be done with the SHRUG, like exploring the distribution of firms across villages. Check out the paper! 13/14
https://www.dropbox.com/s/7qndwxv0k27u56g/shrug_paper.pdf?dl=0
https://www.dropbox.com/s/7qndwxv0k27u56g/shrug_paper.pdf?dl=0
Check out the dataset! All this is based on public data in the SHRUG: http://devdatalab.org/shrug . There's tons of data there already and we're constantly looking to add more.
If you use the SHRUG, please cite this paper. 14/14
If you use the SHRUG, please cite this paper. 14/14
Obligatory erratum: the paper is written with @paulnovosad @tobylunt (not @tobiaslunt...) @ryu_matsuura. Sorry about that Toby!

 Read on Twitter