In a new WP with @nishant_yonzan , @BrankoMilan, and @JanetGornick, we try to "draw a line" Comparing the Estimation of Top Incomes Between Tax Data and Household Survey Data. https://osf.io/preprints/socarxiv/e3cbs/ Here is what we find 1/n
The existing literature suggests that tax data leads to estimates of top income shares that are generally larger than what found using household survey data. E.g. see Burkhauser et al. (2012) for the US comparing CPS data to tax-based estimates from Piketty and Saez (2003). 2/n
Similarly, @CharlyBartels & Metzing (2019) compared results based on income tax data to the German SOEP. Another recent work by Burkhauser, @StephenPJenkin1 et al. (2018), conducted similar exercise for UK data. Yet, no cross-country analyses existed, which is why we step in 3/n
The aim of our paper is to shed more light on this question, using cross-national harmonized microdata from the @lisdata. The core research question in this paper is: Where do the two sources begin to diverge, and why? . 4/n
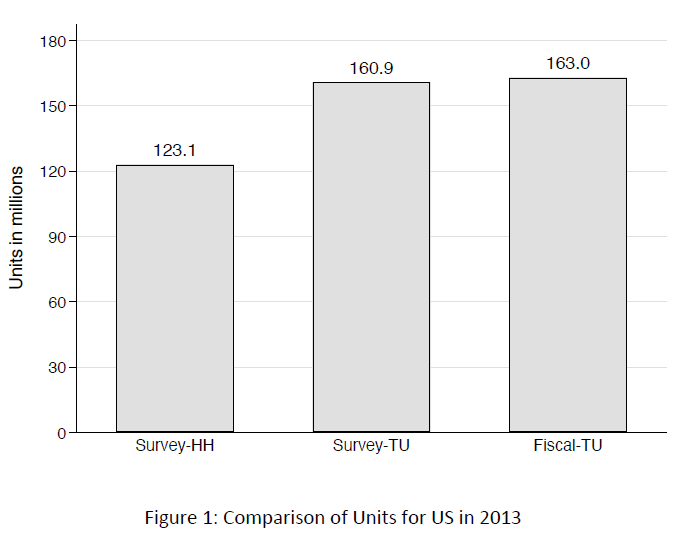
There are several reasons why estimates of top income shares may diverge between tax and survey data. First, the definition of income may be different. Second, income may accrue to different units of analysis (i.e., tax units vs households).
5/ n
5/ n
Third, the 2 types of data are plagued by different under-reporting problems. Whereas tax data suffer from tax exemptions, evasion, & avoidance, household survey data suffer from misreporting, & diff forms of non-response (refusal to participate or to provide specific info). 6/n
Fourth, even in the absence of non-response problems, household survey data may also return biased
estimates of top income shares if their sampling frame does not allow for over-sampling of rich households. 7/n
estimates of top income shares if their sampling frame does not allow for over-sampling of rich households. 7/n
In our paper, we address the first 2 sources of difference: income definitions & units using data for DE, FR, and the US. Thanks to the flexibility of the @lisdata, we are able to construct income variables & units of analysis to match those from tax sources 8/n
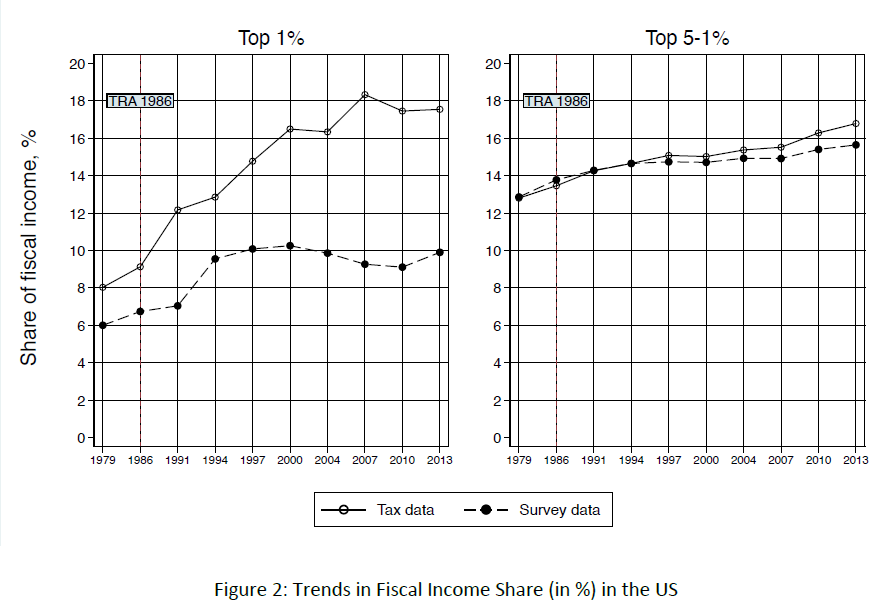
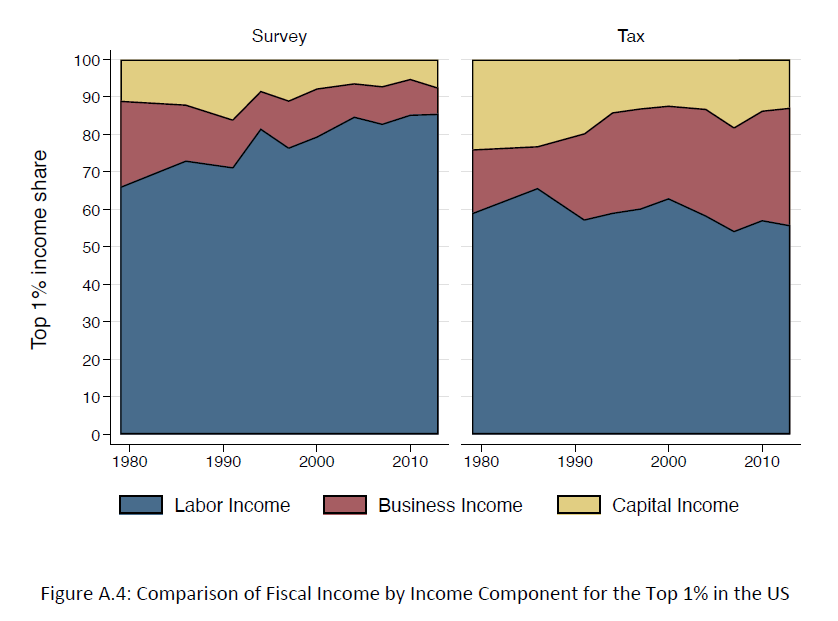
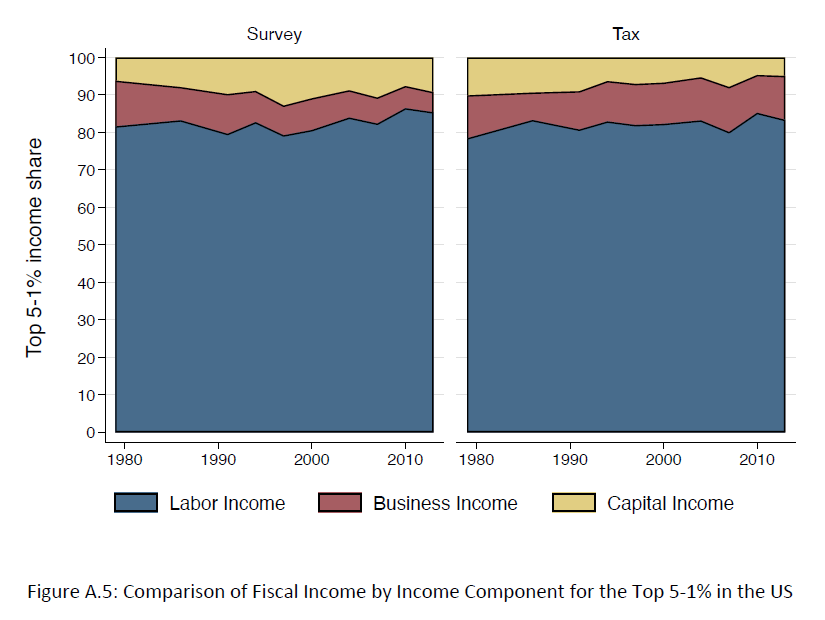
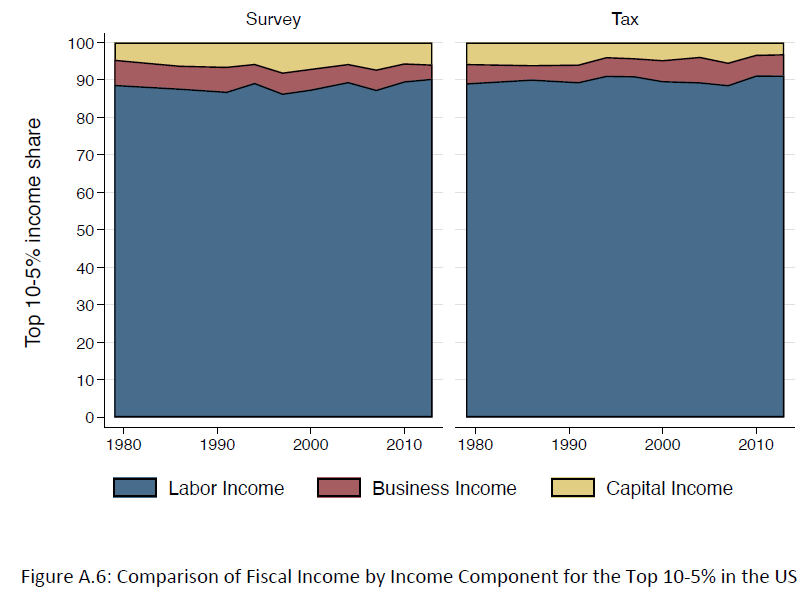
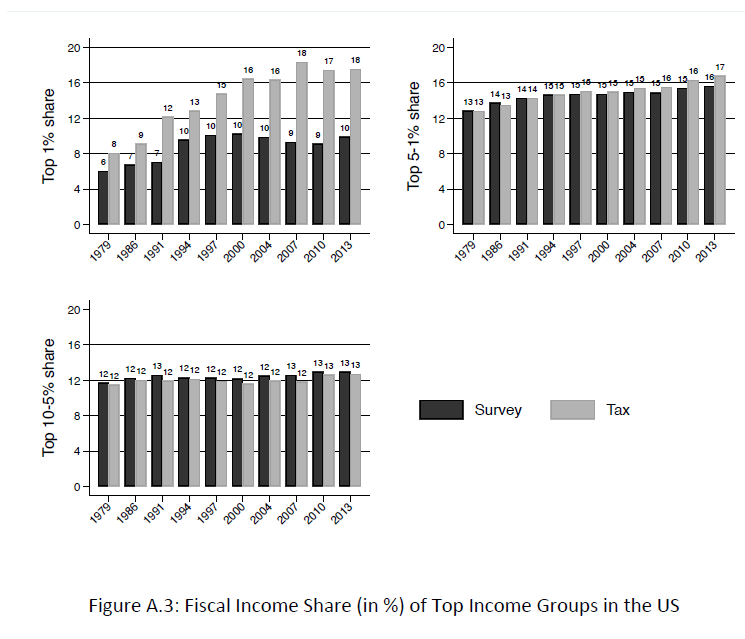
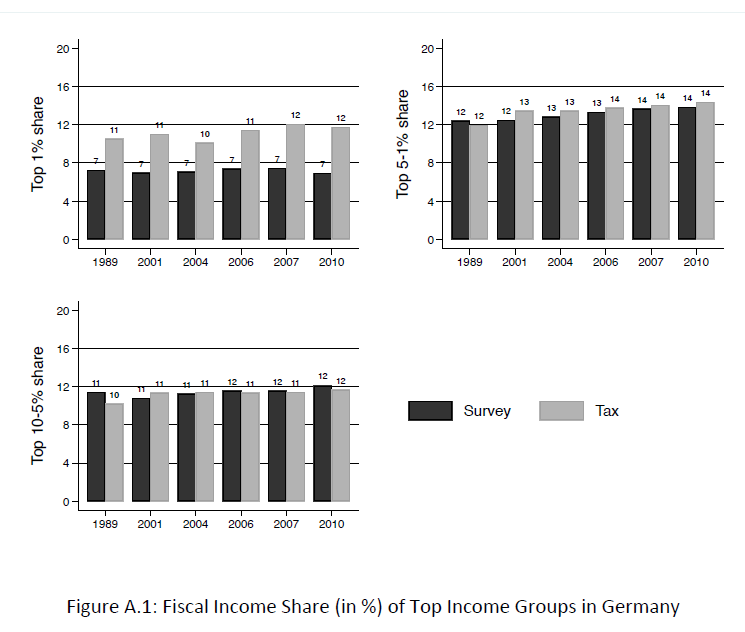
Main results suggest, in light with existing literature, that the share of top 1% income groups is larger in tax data. Income composition at the very top is also different between tax and survey data (more capital & business income in the former) 9/n
Yet, the story below the P99 is more of similarity between the two sources and this was perhaps not sufficiently stressed. Income composition is quite similar across the 2 sources for the top5-top1% an Top10-top5% groups 10/n
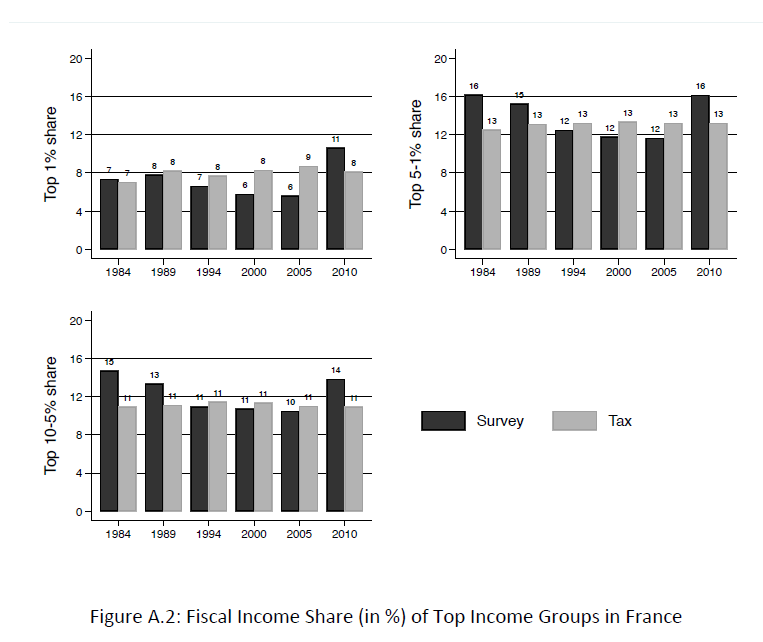
The income shares of these two groups are also very similar in all three countries: US, DE, and FR. 11/n
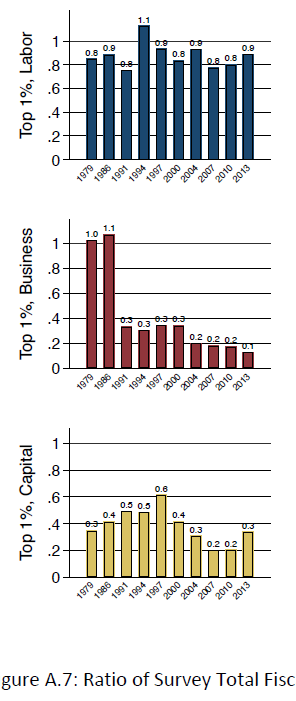
But what drives the discrepancy between the tax and surey data at the very top. Focusing on the top 1% in the US, we could see that total labor income is not too dissimilar among the 2 sources. Capital incomes & business incomes (only post TRA86) drive most of the difference.12/n
Other findings may be mentioned. For example, we find that the estimated annual aggregate fiscal
incomes based on the 2 data sources are more or less equal. Both account for about 65 % of
national income in the US, about 70 % in Germany, and about 45 % in France. 13/n
incomes based on the 2 data sources are more or less equal. Both account for about 65 % of
national income in the US, about 70 % in Germany, and about 45 % in France. 13/n
Our main results confirm that average fiscal incomes of the richest percentile are substantially lower in the survey data than as estimated by tax data. In Germany and the US, this occurs almost entirely above the 99th percentile. 14/n
We, nonetheless, conclude that country-specific assessments of the differences between household survey data & tax data regarding the top 1% remain indispensable. On a more positive note, for 99% of the distribution, we find no significant differences between the 2 sources. 15/15

 Read on Twitter