Got a great question from @generalpatton27 w.r.t. the definition of hypersonic test conditions, as he makes the great point that not all hypersonic flows are created equal. E.g. defining Mach number is not sufficient to define a test
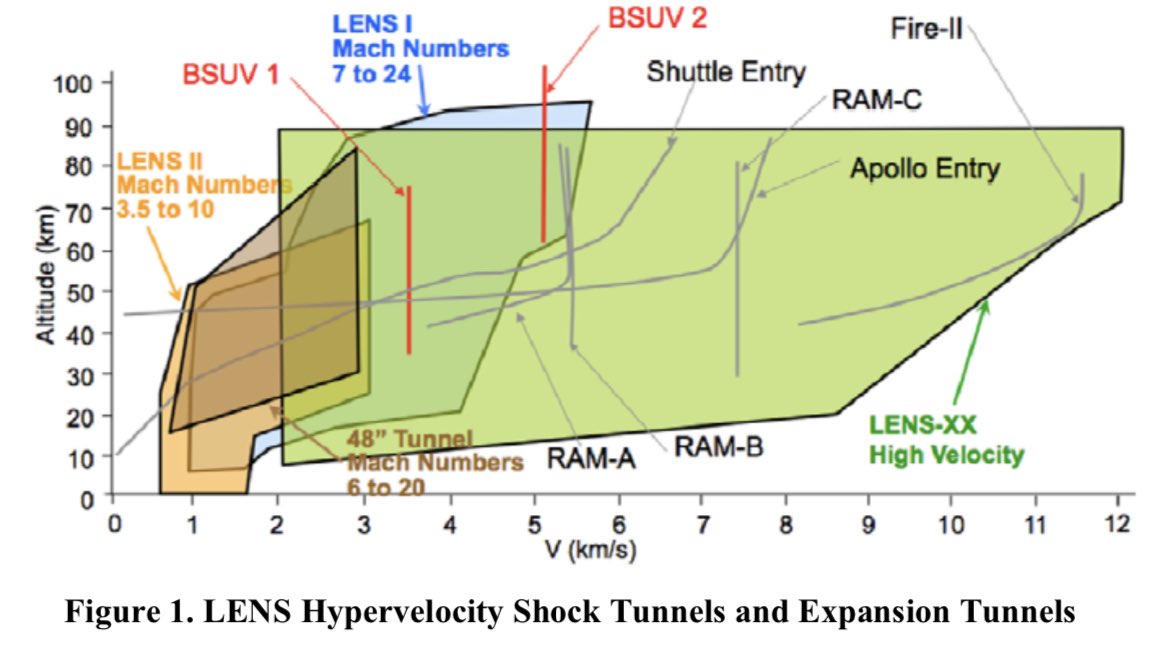
Easiest thing is to give velocity & altitude:
Easiest thing is to give velocity & altitude:
With a specific altitude you should know flight temperature and pressure, then given a velocity you can calculate other things like Mach number and Reynolds number, plus you have chemistry (which isn’t always obvious), so that pretty well defines everything
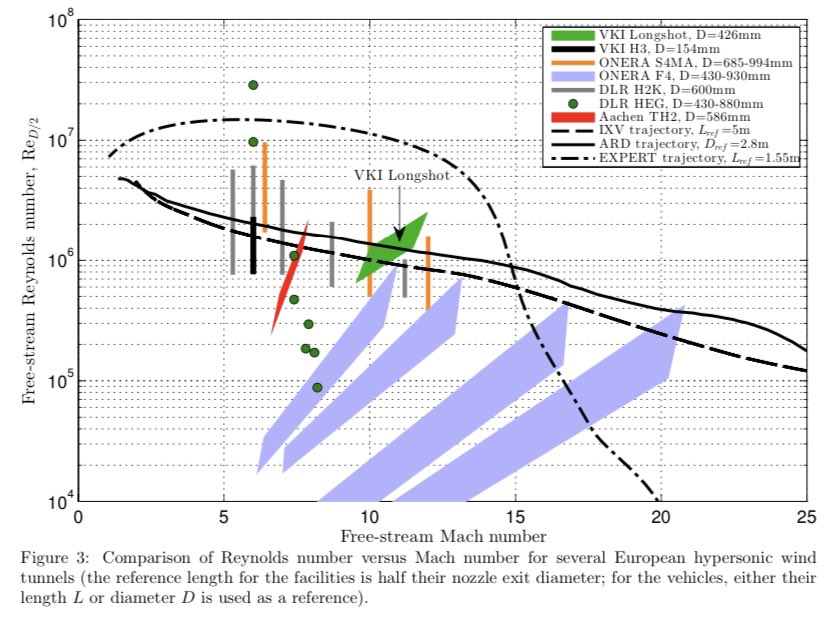
But as experimentalists we often have a facility with a defined Mach number, test temperature, and pressure (which gives us Reynolds #), so perhaps more often than not you see Mach # and Re defined, with a temperature/enthalpy also provided
We like to talk in terms of Reynolds number because it tells us more about the characteristics of the fluid physics—generally higher Reynolds numbers produce more turbulent features (all other things equal)—than a number like altitude
https://www.grc.nasa.gov/www/BGH/reynolds.html
https://www.grc.nasa.gov/www/BGH/reynolds.html
One last point—on the temperature/enthalpy side, while of course we provide numbers in papers, etc, you can often lump facilities into hot (flight-relevant conditions) and cold (cryogenic)
There’s a large gap in conditions between hot and cold hypersonic facilities
There’s a large gap in conditions between hot and cold hypersonic facilities
References for figures
Vel vs altitude chart @aiaa @Calspan_Corp Holden et al 2012
 https://arc.aiaa.org/doi/abs/10.2514/6.2012-469
M vs Re chart @aiaa @vki_vonkarman Grossir et al 2016
 https://www.researchgate.net/profile/Guillaume_Grossir/publication/303907288_Theoretical_Considerations_to_Extend_the_Operational_Map_of_the_VKI_Longshot_Hypersonic_Wind_Tunnel/links/5784e03e08aee45b84448241/Theoretical-Considerations-to-Extend-the-Operational-Map-of-the-VKI-Longshot-Hypersonic-Wind-Tunnel.pdf?origin=figuresDialog_download
Vel vs altitude chart @aiaa @Calspan_Corp Holden et al 2012
 https://arc.aiaa.org/doi/abs/10.2514/6.2012-469
M vs Re chart @aiaa @vki_vonkarman Grossir et al 2016
 https://www.researchgate.net/profile/Guillaume_Grossir/publication/303907288_Theoretical_Considerations_to_Extend_the_Operational_Map_of_the_VKI_Longshot_Hypersonic_Wind_Tunnel/links/5784e03e08aee45b84448241/Theoretical-Considerations-to-Extend-the-Operational-Map-of-the-VKI-Longshot-Hypersonic-Wind-Tunnel.pdf?origin=figuresDialog_download

 Read on Twitter


