Some offline discussions about what has been happening to rape charging rates got me wondering about trends in police recorded rapes (and the impact of changing crime recording practice). Here I look at what has happened at force level in E&W since early 2012/13.
1/
1/
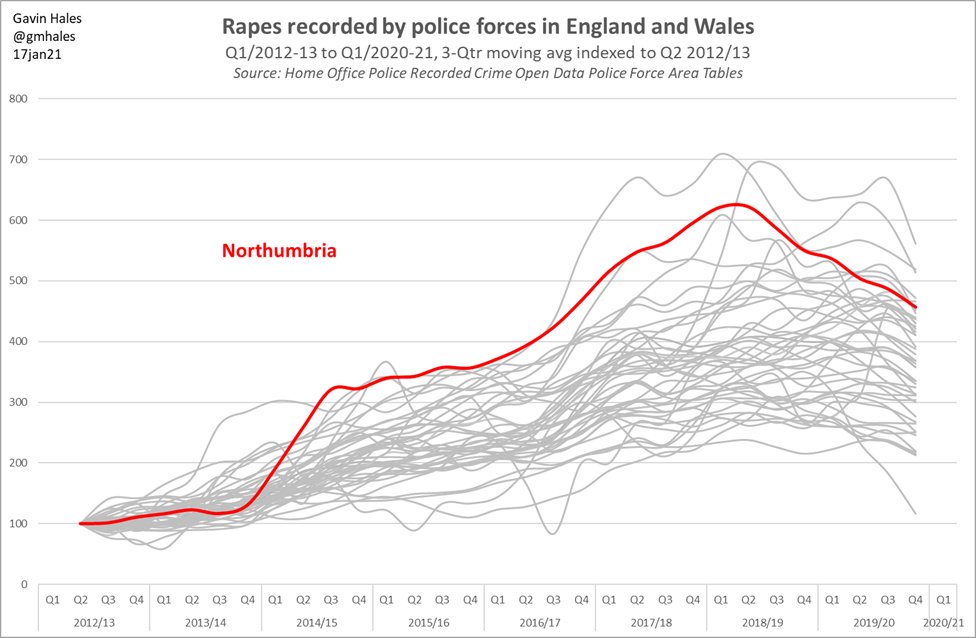
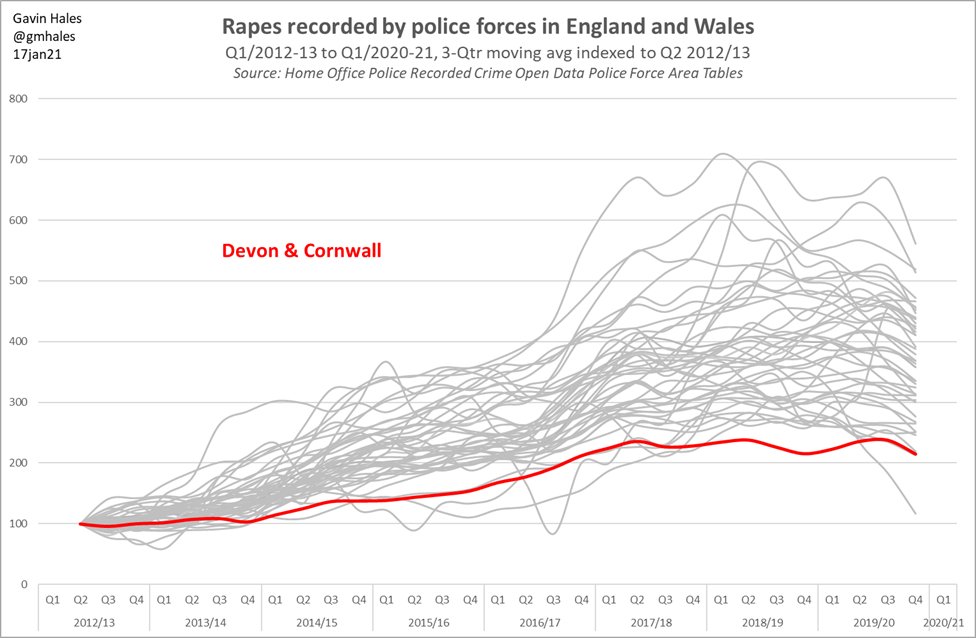
The chart shows police recorded rapes by quarter from Q1/2012-13 to Q1/2020/21. I've used 3-Qtr rolling avgs to smooth the lines a bit, and have *indexed* the data so trends are easily comparable. E.g. 200 = doubled since Q2/2012-13 (avg of Q1, Q2, Q3); 300 = trebled, etc.
2/
2/
Across E&W, the number of rapes recorded by police forces increased 3.7-fold from 16k in 2012/13 to 60k in 2018/19, before a slight fall to 59k in 2019/20. NB in the raw data all but 2 forces ( @ClevelandPolice & @Glos_Police) saw a fall betn Q4/2019-20 & lockdown Q1/2020-21.
3/
3/
To highlight a few of the outliers: @bedspolice, @kent_police, @LincsPolice and @northumbriapol all saw increases peak above 6x the early 2012/13 baseline (Kent and Beds touched 7x).
4/
4/
To understand these trends one would have to unpick the contribution of changes to: (a) offending rates, (b) rates of reporting to police (of both recent & historical allegations), and (c) police crime recording practices (notably in the context of @HMICFRS scrutiny).
6/
6/
If you are aware of any analysis unpicking these factors in relation to rape, please let me know.
For other crime types the impact of changing crime rec practice can be seen by combining CSEW evidence & police recorded crime. Discussed in this blog: http://www.police-foundation.org.uk/2018/03/crime-blame-police-crime-survey-england-wales-tells-us-police-crime-recording-practices-exposes-limitations/
7/
Data source for the charts in this thread: @ukhomeoffice "Police recorded crime open data Police Force Area tables from year ending March 2013 onwards" https://assets.publishing.service.gov.uk/government/uploads/system/uploads/attachment_data/file/928924/prc-pfa-mar2013-onwards-tables.ods via https://www.gov.uk/government/statistics/police-recorded-crime-open-data-tables as at 14 Jan 2021.
8/8
8/8
As almost always, I did this analysis on my own time. If you found it helpful, you can support me at https://ko-fi.com/gmhales . Many thanks.
9/
9/

 Read on Twitter


