Here's a step by step on how I setup my Delayed Attribution Multiplier dashboard in Google Data Studio... 
1. Create a data source for each attribution model: 28dc/1dv, 7dc/1dv, 1dc/1dv
2. Create a scorecard and choose blended data.

1. Create a data source for each attribution model: 28dc/1dv, 7dc/1dv, 1dc/1dv
2. Create a scorecard and choose blended data.
3. Add each individual data sources and pick 'website purchases conversion value' for the metric. But rename it to something cooler. Like Revenue 28dc/1dv, Revenue 7dc/1dv, Revenue 1dc/1dv.
4. Should look like this...
4. Should look like this...
5. Next step is creating a custom metric. For this you'll click on the metric and choose 'Create Field'.
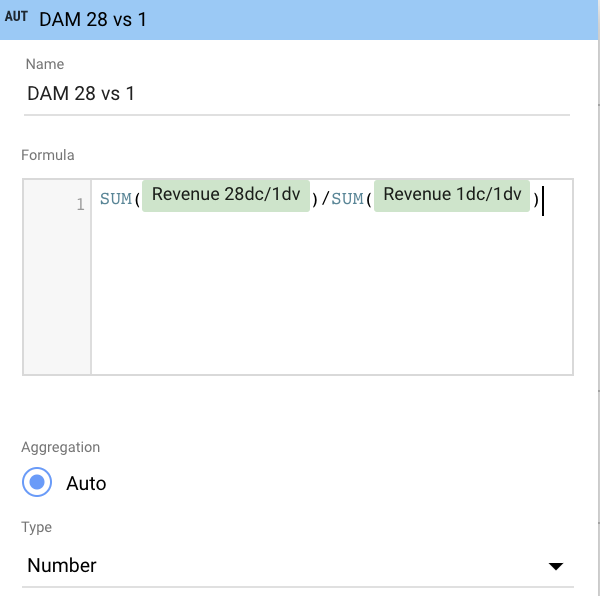
6. Then enter in the formula below. I always like to use sum before the metric. Good practice if you like using filters.
6. Then enter in the formula below. I always like to use sum before the metric. Good practice if you like using filters.
7. Then BAMMM set date to last 28 days and you have a nice scorecard showing your DAM for 28 day vs 1 day.
8. From there you can get fancy and do stuff like see what your 28d vs 7d DAM is. Or what your ROAS would look like after 28 days for yesterday or the last 7d.
8. From there you can get fancy and do stuff like see what your 28d vs 7d DAM is. Or what your ROAS would look like after 28 days for yesterday or the last 7d.
9. Or plot your DAM over time to see where it stabilizes. You can use that date as an estimate for time to purchase which can help you figure your top performing date range for retargeting. 
For high AOV brand you'll see your DAM stabilizing probably after 10 to 14 days.

For high AOV brand you'll see your DAM stabilizing probably after 10 to 14 days.
I know someone is gonna chime in and say 1 day click is rulez all. But you can't deny the lift in performance that advertising a few days ago has on today.
BUT I still really like looking at daily trends over last 14 days with 1 day click to compare apples to apples.
Ok bye!
BUT I still really like looking at daily trends over last 14 days with 1 day click to compare apples to apples.

Ok bye!

 Read on Twitter


