0/n Let us rewind to January of 2018. As you know, much water--not wholly clean--has flowed down the Mithi River in the past three years, impacting equity markets in a big way. And let us examine how equity mutual funds have done in this time period.
1/n Why did you choose Jan2018, you may ask. Govt of India on 01Feb2018 announced introduction of long term capital gains (LTCG) tax on equities, but allowed grandfathering of gains (if any) up to 31Jan2018.
2/n Effective 01Apr2018, 10 per cent tax on long term capital gains (LTCG) was introduced, with large negative impact on long-term equity returns. This has also changed the behaviour of long term equity investors.
3/n By looking at the past nine month Sensex returns, many short-term oriented participants are jubilant--quite naturally. But if you look at the broader market, many stocks especially in the automobile, capital goods, media, utilities sectors are below their 31Jan2018 levels.
4/n The last three years have been challenging for equity mutual funds also. Let us see how they have performed in the past three years, even though we intuitively know they have been doing a bad job in the aggregate--not entirely their own volition.
5/n I've used data from Value Research online for calculating point-to-point (P2P) returns between 31Jan2018 and now, that is, 15Jan2021. I've considered only direct plans of open-ended equity mutual funds excluding sectoral funds for this analysis.
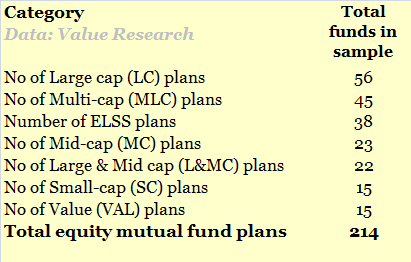
6/n In total, there are 214 equity MF plans. Value Researach weblink > https://www.valueresearchonline.com/funds/point-to-point-returns/primary-category/equity-excluding-sector/?start-date=31-Jan-2018&end-date=16-Jan-2021&end-type=1&plan-type=direct&tab=snapshot
The break-up of the plans, as classified by Value Research, is as follows >
The break-up of the plans, as classified by Value Research, is as follows >
7/n These EMF plans are well diversified. But they follow their own investment styles and benchmarks. As such it would not be prudent to measure them against the returns of a single benchmark, such as, Sensex or Nifty 50 index.
8/n The approach I followed to assess their performance is to use different benchmarks--like expected equity market returns as of January of 2018, BSE 200 and Sensex returns.
9/n A recent Reserve Bank of India (RBI) study has stated that the equity risk premium (ERP) for Indian market is 4.7 per cent. Let us round the ERP to 5 per cent. ERP indicates the excess return one can generate through equities over the safe return of government bonds.
10/n Basically, equity risk premium (ERP) is the return needed to compensate for the extra risk we take by investing in equities. To arrive at the expected equity return, we need to add ERP to the risk-free rate (RFR). We can consider 10-year G-sec yield as the RFR.
11/n This is just a thumb rule for arriving at the expected equity returns. (There are various approaches, like the one @AswathDamodaran uses, to calculate expected equity returns and equity risk premium).
12/n As at the end of Jan2018, the 10-year India G-Sec yield was 7.40 per cent. Add the 5 per cent ERP to this yield, we get an expected equity return of 12.40 per cent. An investor taking exposure to Indian equities as of Jan2018 would have expected a return of 12.40 per cent.
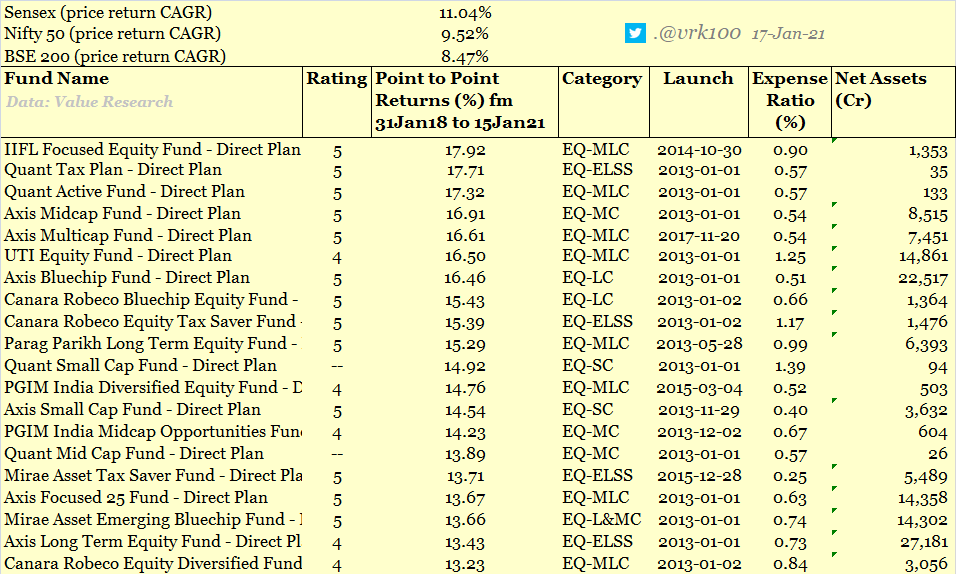
13/n Let us see how many of the EMF plans have generated returns in excess of the expected equity return. Of the 214 plans examined, only 20 plans or 9.3 per cent have generated returns more than the expected 12.40 per cent (these are annualised returns or CAGR). They are >
14/n Between 31Jan2018 and 15Jan2021, Sensex gave a price return of 11 per cent annualised (CAGR). Of the 214 plans, only 35 plans or 16.4% of the total have generated returns more than Sensex return. These funds are (in addition to the 20 mentioned above) >
15/n Between 31Jan2018 and 15Jan2021, BSE 200 gave a price return of 8.50 per cent annualised (CAGR). Of the 214 plans, only 100 plans or 46.7% of the total have generated returns more than BSE 200 return during the time period.
16/n As can be seen from above, funds from the following AMCs have done well: Axis MF, Canara Robeco MF, Mirae Asset MF, PGIM MF and Quant MF. So are BNP Large cap, Parap Parikh LTE, DSP Equity, Invesco Midcap, and UTI Equity fund.
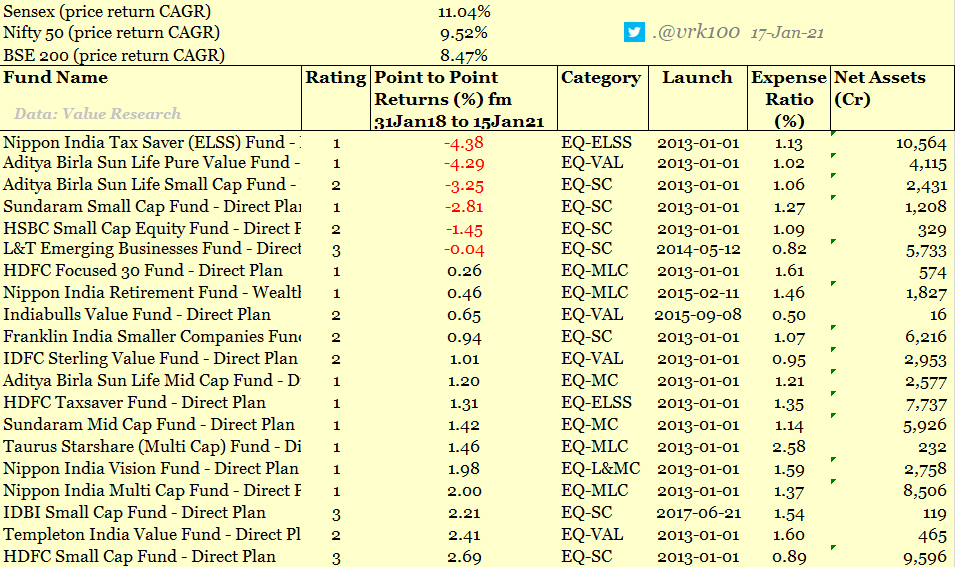
17/n And which are the worst performing EMFs during this period? You'd have already guessed by now. These large-sized AMCs are: Aditya Birla Sun Life MF, Franklin India MF, HDFC MF, ICICI MF, IDFC MF, L&T MF, Nippon India MF and Sundaram MF.
18/n It's a surprise for me that there are six equity mutual funds whose NAVs are still below the 31Jan2018 level. The list of Bottom 20 equity mutual funds that have given the lowest returns during the period examined are >
19/n When we examine the returns category-wise, the worst performing categories are: Small-cap (SC) and Value oriented funds. Twelve of the 15 SC plans and 11 of the 15 Value funds generated returns below 8.50 per cent. As can be expected, large-cap funds have fared well.
20/n The poor record--not entirely their own volition--of Indian equity mutual funds, especially, in the past three years is reflected in the equity mutual fund outflows. It's interesting to watch what strategies mutual funds will adopt to stem the rot.
21/n This is not recommendation for buying or selling. This is just for educational purpose. It's safe to assume that I've a vested interest in the financial markets. Please consult your financial advisor before making any investment decisions. Happy investing!
22/22 Gross underperformance by active mutual funds is a global phenomenon, dating back to 50 years. This is brought out by SPIVA reports every half-year brought out by S&P Global.
For more on this, you can check the reports related to Indian MFs also > https://twitter.com/vrk100/status/1089828748721938433
For more on this, you can check the reports related to Indian MFs also > https://twitter.com/vrk100/status/1089828748721938433

 Read on Twitter


