Is market overvalued?
Market ka kya lagta hai?
What is NIFTY PE?
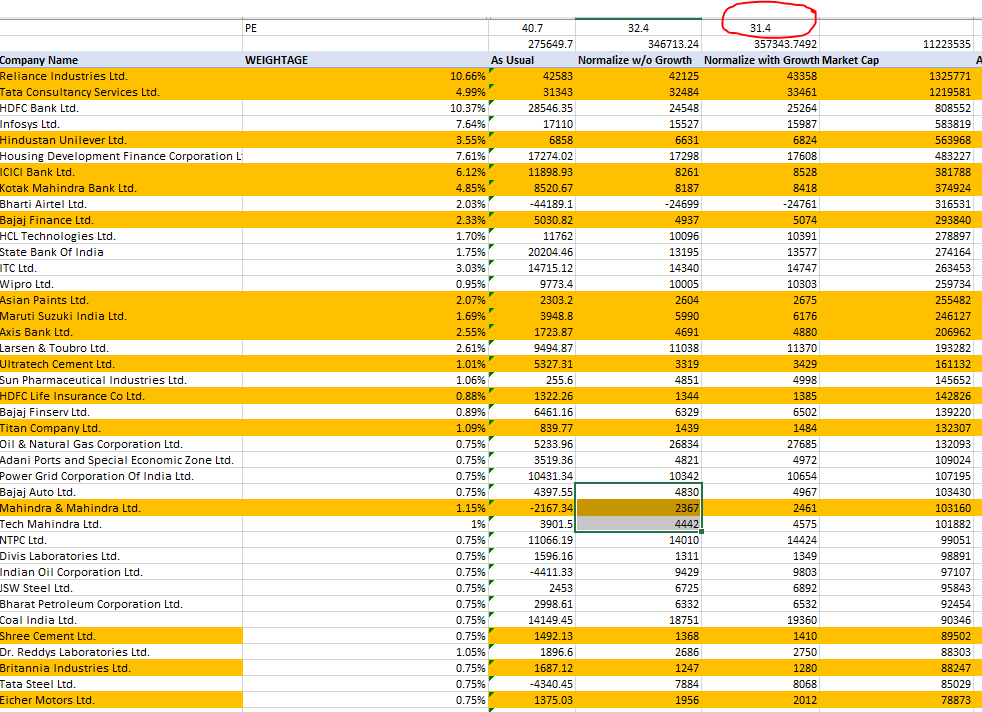
Well, current PE of NIFTY is 40 but there is more..
A thread covering these questions. 1st thing, uploaded a youtube video on the same. Can watch it n subscribe to channel if like
Market ka kya lagta hai?
What is NIFTY PE?
Well, current PE of NIFTY is 40 but there is more..
A thread covering these questions. 1st thing, uploaded a youtube video on the same. Can watch it n subscribe to channel if like

The 40 PE of NIFTY is considering TTM earnings (in the table) which includes quarters affected by Covid and we all know that there were temporary business shutdowns due to Covid. So, is not this an outlier situation. So, how to handle it
One way to handle it is- Ignore Covid quarters and go back to previous quarters assuming same performance during Covid quarters. Now the 40 PE reduces to 32.4. Almost a 20% reduction
But then NIFTY 50 grew at approx 4-5% in EPS on YoY basis before Covid hit us,so, let us take that growth rate previous year quarters and replace Covid quarters by this number. PE changes to 31.4. We have 3 scenarios 1. As is 2. Pre-Covid based 3. Pre-covid + growth based
So, the next question is - Is NIFTY and market overvalued? Looks so but we need to fix few more anomalies . The first one we tried to fix was Covid event anomaly but if you see the NIFTY index weightage , out of 50, 8 companies have 56% weightage, So, is it market view or NIFTY
view or just these 8 companies view because the fate of these 8 companies will decide market view which may or may not be the case. Other thing PE is a metric which should be used in normal cases where there is an earning certainty and company is not in loss.
Now to fix above 2 issues, let us do this:
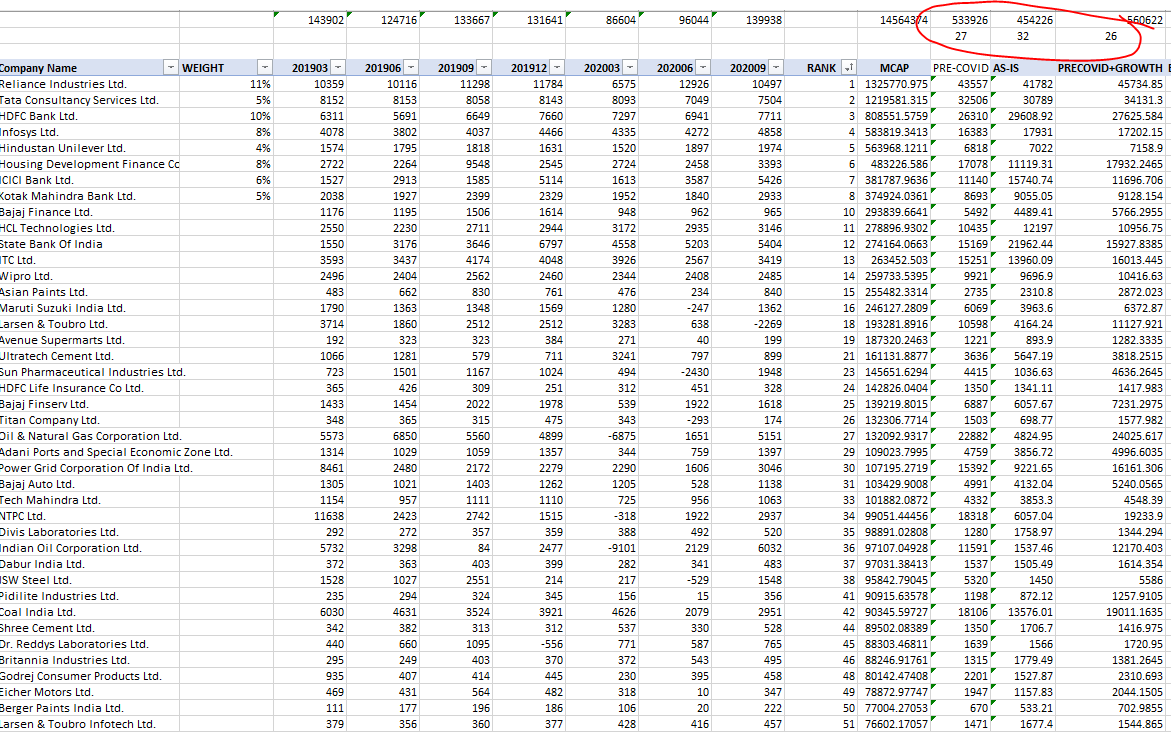
1. Take bigger base , like top 200 companies by marketcap
2. Look for companies in losses and remove as they would skew overall PE figure
Below r highlighted one (not full 200 list below)
Lets get rid of all RED one in full list
1. Take bigger base , like top 200 companies by marketcap
2. Look for companies in losses and remove as they would skew overall PE figure
Below r highlighted one (not full 200 list below)
Lets get rid of all RED one in full list
Now, we have as-is PE, pre-covid PE and pre-covid+4% growth PE as 32,27 and 26. Quire a reduction from 40 to 26 almost 35%. You lay with data and make it talk the way you want  leave it to you to decide. Lets move forward
 leave it to you to decide. Lets move forward
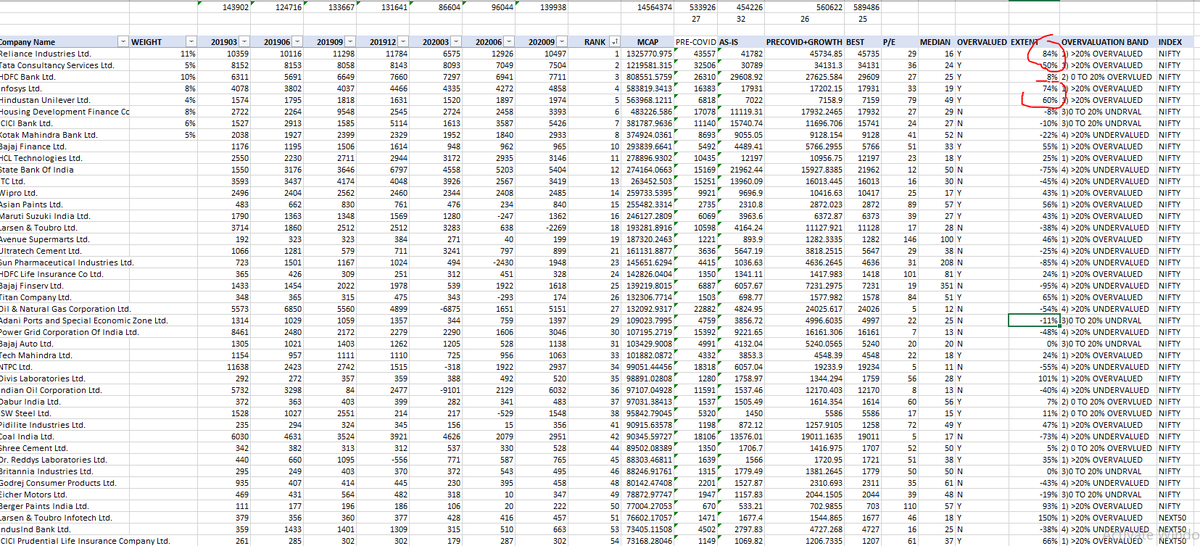
To check if overvalued, let us go back to history company by company and see if respective companies are overvalued (we all want quality, kotak, HDFC, Saurabh Mukharjee Coffee can then why crib overvalued just looking at PE). So, we add 1 more column, last 6 yr stock median PE
Oh god, Reliance is 84% costly but future cant be interpreted from past, me idiot, Jio hai na, TCS and Infosys are 505 costlier but so what digital hai na, momentum hai na, margin improvement hai na.. so, 4 out of top 8 of NIFTY which compose 56% of NIFTY are >50% costlier
How about rest? Let us dig full 200. Below is a snapshot. More than half of NIFTY is overvalued and more than 405 companies are more than 20% overvalued. The same is around 1/3rd in rest of the pack. Also, there r 1/3rd of companies which are undervalued if we can trust history
But then value investing is dead :) or who knows there is always a bubble somewhere n opportunity somewhere  . End of thread
 . End of thread

 Read on Twitter


