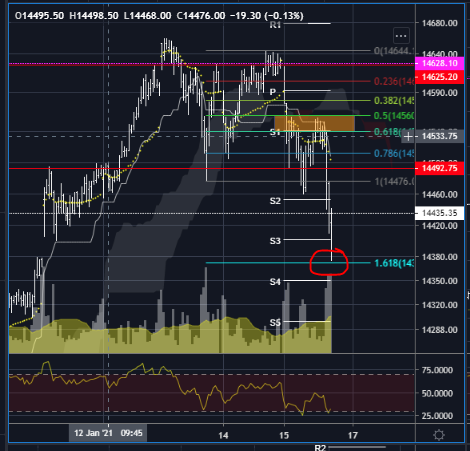
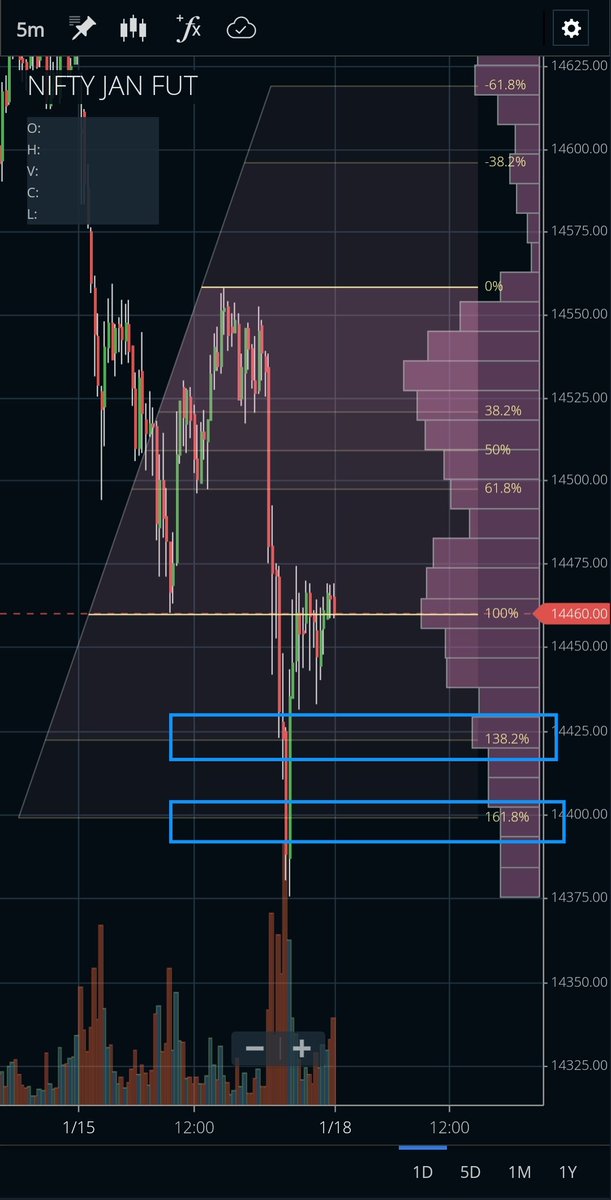
#Fibonacci is best drawing tool who want to calculate level.
As i said earlier chart is kind of properties like wave, its keep rising and falling.
But question is which level, so there r some magical number which occurs most of the time like 38% and 62%.
As i said earlier chart is kind of properties like wave, its keep rising and falling.
But question is which level, so there r some magical number which occurs most of the time like 38% and 62%.
Even 50% using but its not official fib no. but kind of psychology no. and can be used too.
So many more level but i give importance to only three of them.
So, first question how to draw, simply use as any swing low to swing high, if spike too big then can be avoid spike use body
So many more level but i give importance to only three of them.
So, first question how to draw, simply use as any swing low to swing high, if spike too big then can be avoid spike use body
So whenever mkt retracement happened then u will see mostly small support to these numbers like 38% or 62%. My personal fav 62% but if mkt strong then generally u will see mostly reverse from 38% level.
This tool work for all tf most perfectly, Even i keep using on 5 or 15 mins.
This tool work for all tf most perfectly, Even i keep using on 5 or 15 mins.
If you see mkt failed to hold such level then its become as resistance which normally work like support earlier. (Attached img. U can understand little bit).
There are some extension level when ur swing high or low broken, then same level most preferred target level for any swing.
Or simply draw another fib just opposite which give the extension level.
Or simply draw another fib just opposite which give the extension level.
Just do simple practice and draw simple fib from low to high and keep tracking it on old chart and also do practice live few days u will be expert in it.
Thanks
#sftrading
Thanks
#sftrading

 Read on Twitter


