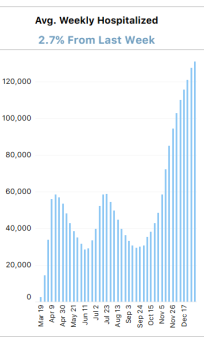
The @COVID19Tracking shows a very steep chart of #COVID19 "current hospitalizations." We 100% should track this ebb & flow to make sure our hospitals aren't overly burdens (another topic).
However note: "current hospitalizations" DOES NOT EQUAL "number of cases hospitalized"
1/
However note: "current hospitalizations" DOES NOT EQUAL "number of cases hospitalized"
1/
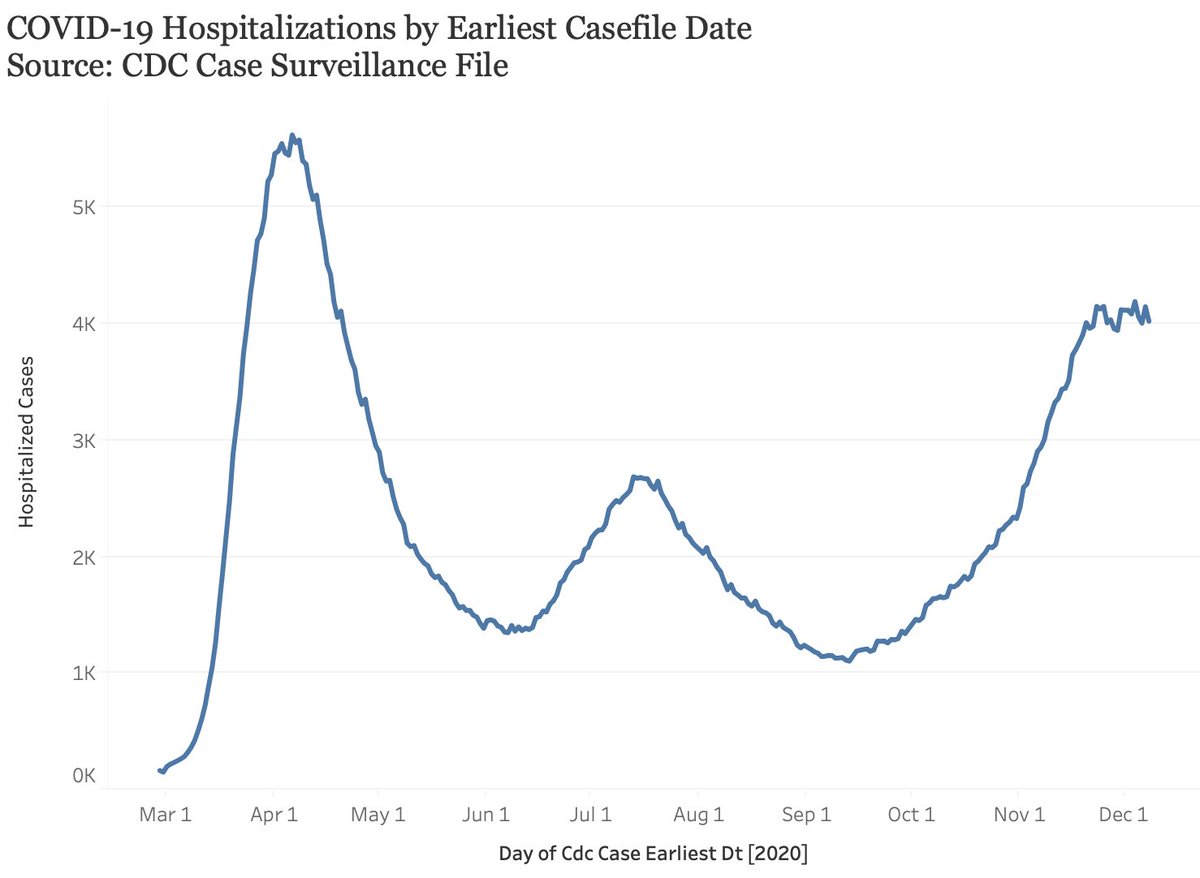
My chart on the left is taken from the CDC case surveillance file and shows cases with known hospitalization status by earliest date on record. The
CTP chart on the right shows # of people currently hospitalized.
So, what's happening?
2/
CTP chart on the right shows # of people currently hospitalized.
So, what's happening?
2/
One factor is a change in treatment.
In late October approval was given for Rendesivir which requires a 5-day hospital stay and treatment plan. Most patients have serious improvements by day 2 but are required to get the full allotment.
Average num of days/stay is up.
3/
In late October approval was given for Rendesivir which requires a 5-day hospital stay and treatment plan. Most patients have serious improvements by day 2 but are required to get the full allotment.
Average num of days/stay is up.
3/
Our own @AJKayWriter noted a whole series of issues back in November leading to hospitalization numbers changing. For example, also in October, hospitals could count observation beds as COVID beds.
4/ https://twitter.com/AJKayWriter/status/1328802885530910722?s=20
4/ https://twitter.com/AJKayWriter/status/1328802885530910722?s=20
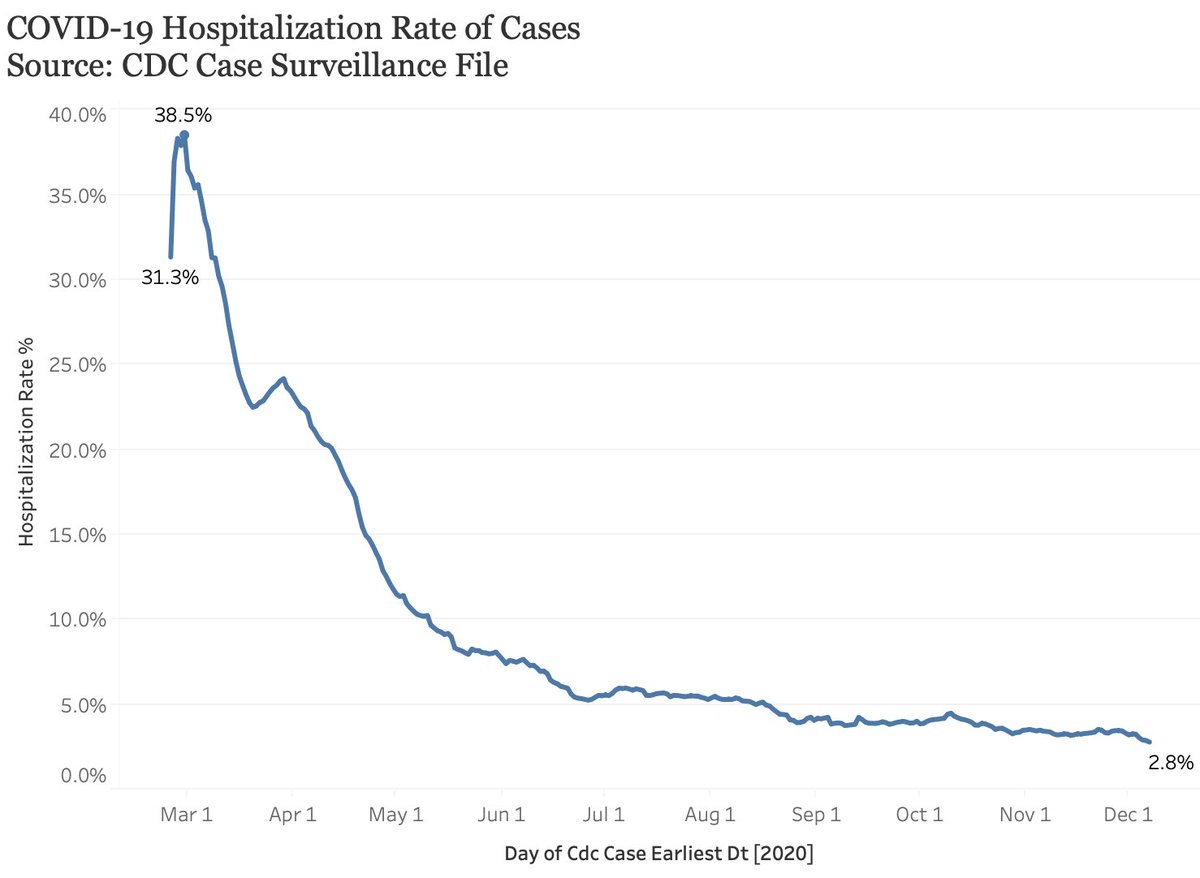
Lastly note that the rate of hospitalization has dropped below 3% - which is about what it is for influenza.
Bottom line. Don't confuse longer hospital stays and more cumulative current people in the hospital with actual number of people who have hospitalized because of #COVID19.

 Read on Twitter


