i mean by my count is 550,000 but YMMV https://twitter.com/sangerkatz/status/1350130677690331136
The math on this pretty simple.
First, you take CDC's reported deaths. Then you make an adjustment for underreporting of recent deaths. Various ways to do that I won't get into here, but all methods yield similar results.
First, you take CDC's reported deaths. Then you make an adjustment for underreporting of recent deaths. Various ways to do that I won't get into here, but all methods yield similar results.
Then you compare deaths in each week to deaths in each week in prior years.
Various ways to set a baseline. But one uncontroversial way to set a *maximum* expectation for "normal deaths" is to take:
1) maximum deaths in a given week 2014-2019
2) multiply by pop growth
Various ways to set a baseline. But one uncontroversial way to set a *maximum* expectation for "normal deaths" is to take:
1) maximum deaths in a given week 2014-2019
2) multiply by pop growth
Multiplying by population growth *itself* can create endogeneity and is an unknown parameter, so we can multiple instead by the average yearly change in deaths 2014-2019, about 1.7% increase each year due to population growth and aging.
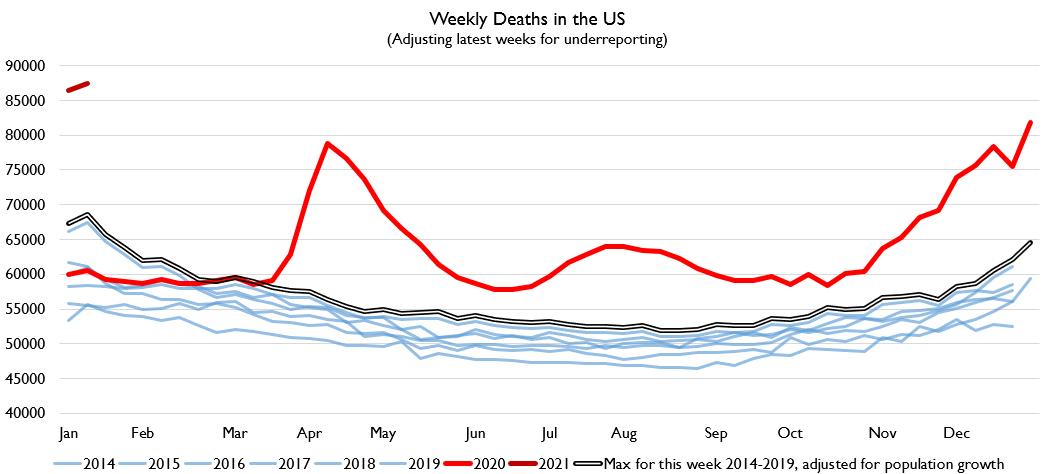
So here's what actual deaths look like compared to if we assume every week of the year was as bad as the worst that week has been in any year 2014-2019, but then was actually 1.7% worse than that worst week.
The space between that "every week is the worst ever" line and the "what actually happened" line adds up to 450,000 deaths.
In other words, the *absolute minimum* excess death count since late February is 450,000.
In other words, the *absolute minimum* excess death count since late February is 450,000.
However, this is a silly standard. Assuming that the "normal baseline" for 2020 would have been "the maximum we've observed for each week times 101.7%" is a bit odd.
It's not clear to me why you'd assume that the baseline expectation for deaths in 2020 was that every week would individually be the worst it's ever been.
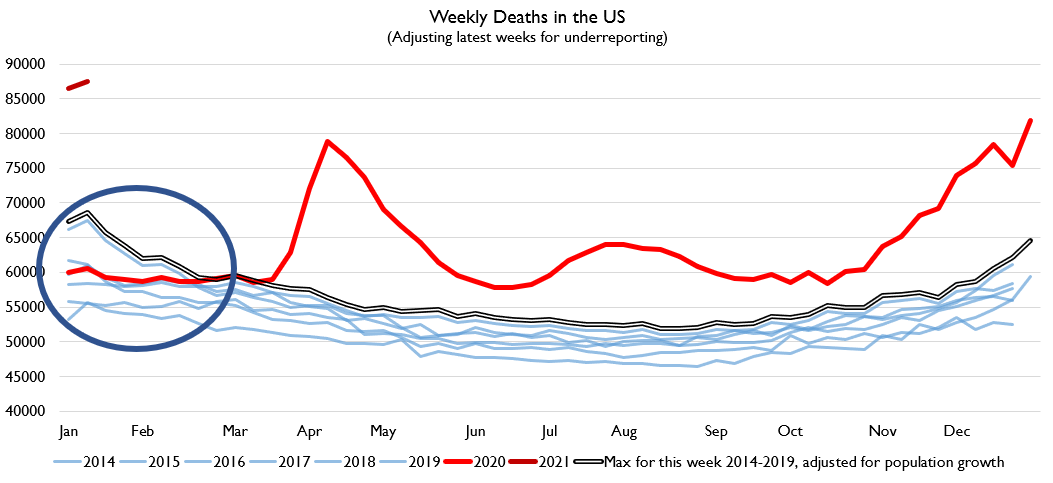
Furthermore, it's pretty clear that COVID excess deaths were piling up from a below-zero baseline. Look where circled here. Normally, even in low-flu-death years, deaths decline during February. But they stayed flat! Flu deaths falling, but COVID rising, but from a below-0 start.
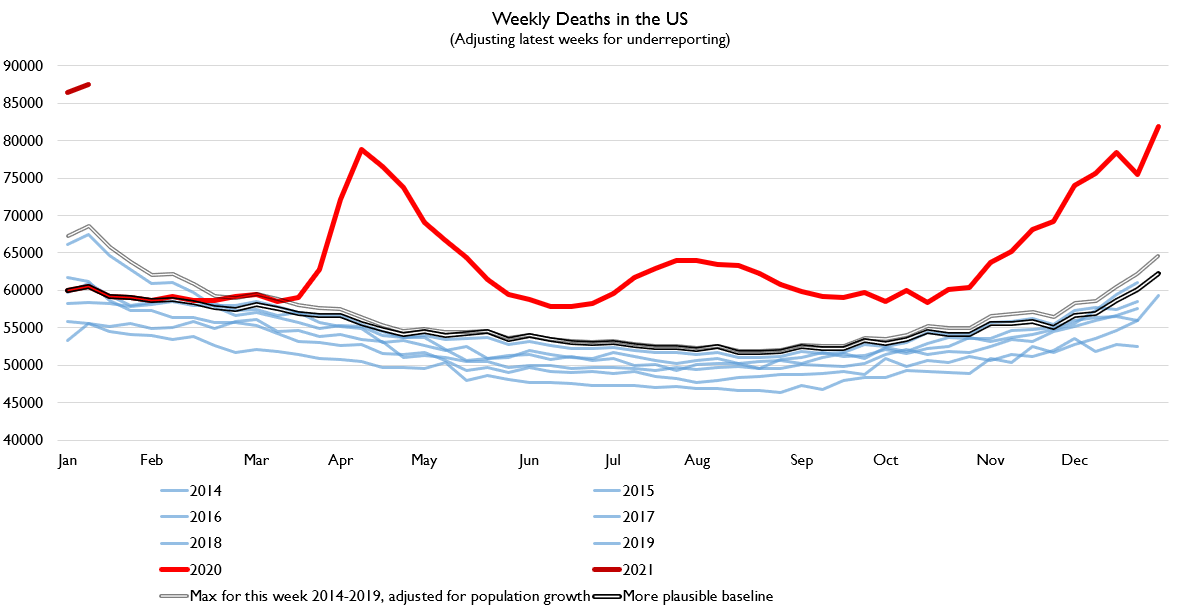
So if you make a more plausible baseline for 2020 based on not just arbitrarily assuming it was always going to be the worst ever all the time but imagine a world where it might have been sometimes-not-the-worst, you get this alternative baseline. Which yields 485,000.
But this is still very weird. Because it's still assuming a relatively severe flu season. What we actually observe in reality is that there's basically been zero flu season. Of course, we know why that is: because COVID precautions have reduced flu deaths!
But if we start getting into this thorny issue of changing cause of death, we would also need to adjust for things definitely not related to COVID, like, say, car accidents.
So, let's do it, and show once again as I have shown a million times that these excess deaths are overwhelmingly COVID, not suicide and drug overdose.
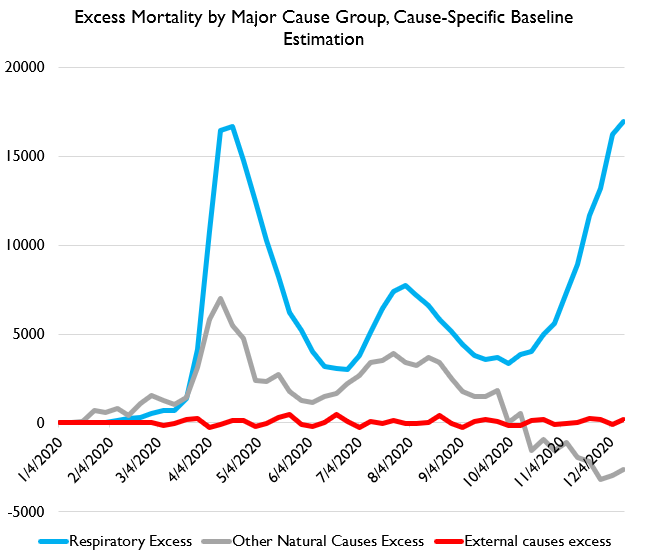
So here's major cause categories. What you can see is respiratory deaths are SUPER HIGH and other natural causes deaths are SUPER HIGH and mostly correlated with respiratory deaths and external causes deaths are kinda high too!
But the key thing to understand is that in the first two waves, those excess natural causes deaths ***are COVID deaths***. They just didn't get appropriately counted. They occur in the same times and states and in the same age groups as COVID excess mortality.
I'm not gonna bother demoing that here since I'm demo'd it about 10 other times. Suffice to say: the spike in non-COVID natural causes deaths IS COVID DEATHS which are being under-reported.
But comparing to 2019 is crude. Let's once again built a more plausible counterfactual accounting for pre-trends!
So now we're separately modeling excess deaths for respiratory, other natural, and excess deaths.
If we do that, we get an interesting result. It turns out the rise in external causes deaths is.... pretty normal based on the underlying time trends and the pre-COVID period! But trends for others are not.
Now, cause of death data, even with adjustments for incompleteness, is only viable thru December 12. So it turned out, through that period, I had estimated 391,000 excess deaths.
We can attribute 378,000 excess deaths to non-external causes.
We can attribute 378,000 excess deaths to non-external causes.
But actually more if we allow our baseline to be a "low flu season" rather than a "high-ish flu season."
There have been more deaths since then. And if you suppose that 2020 was actually gonna be a low death year (plausible since life expectancy improved 2018-2019), then your baseline falls lower.
It is by assuming a baseline of continued life expectancy improvements similar to 2018-19 for 2019-20 that you get my very high figure of 550k. I know not everybody will buy that. But I think 2020 really was shaping up to be a good year in terms of health!
What little lab data we have even suggests our flu vaccine was going to be highly effective; i.e. that the labs picked the "right strains" of flu to target!
So I think the correct counterfactual is actually "a year of considerable life expectancy improvements." Which is why I get 550k. But as I said, YMMV. You can plausibly be from 450k to 550k.
But 400k is too low.
But 400k is too low.

 Read on Twitter


