Our Comment in @ScienceMagazine today shows #NMR #diffusion measurements can lead to exciting, but incorrect, results if you aren't careful! @Lucy_Fillbrook @tscmacdonald and collaborators at @MPI_IS and @westernsydneyu. Thread below! #NMRchat https://science.sciencemag.org/content/371/6526/eabe8322
Building on our @ChemPhysChem paper where we outlined a technique for measuring diffusion coefficients over time https://onlinelibrary.wiley.com/doi/abs/10.1002/cphc.201900150
That we then applied to examples of enhanced diffusion of small-molecule catalysts https://onlinelibrary.wiley.com/doi/full/10.1002/anie.201910968
Which led, in a small part, to the publication in July last year of this @ScienceMagazine paper which immediately seemed odd to us https://science.sciencemag.org/content/369/6503/537
After discussions with the authors, we started immediately looking at one of the reported reactions.
We looked for problems with convection (as we’d found for the @angew_chem paper the year before), but this didn’t seem to be a big issue this time around (D2O is pretty viscous compared to benzene!)
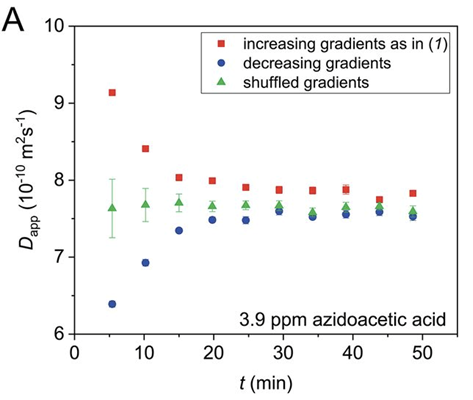
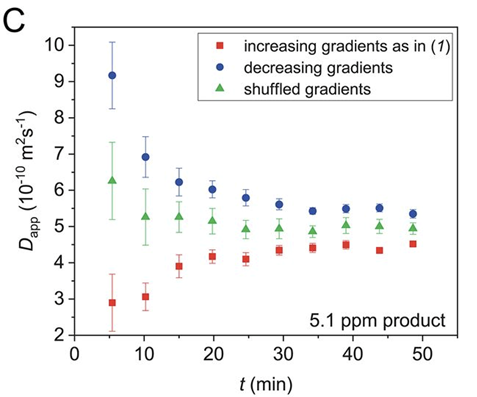
We then found that we could observe either faster or slower diffusion depending on the order of the gradients we used, for example for the starting materials:
Around this time we were contacted by an independent lab in Germany, Jan-Philipp Günther, Peer Fischer and Günter Majer who had also been attempting the reaction and were reaching the same conclusions.
This was essentially the key message from our previous papers: if there is a correlation between the applied gradients and changes in signal intensity you’ll get data that looks great, but is wrong. Shown here for a simulation of a simple X -> Y reaction where D = 1.00 x 10^-9
The solution is relatively simple: jumble up the gradient list to remove any correlation between the applied gradients and the signal intensity changes! Although the fit won’t look as good, the obtained diffusion value is accurate, shown here for the reaction starting material:
At first we thought the problem could be caused by the changing concentrations of the species being observed (as we’d discussed in the @ChemPhysChem paper).
But then we found the spin-lattice (T1) relaxation constants for the species were rapidly changing, which we mentioned in our Comment (~50 ms to more than 2 s within the 1st 20 mins of the reaction). That makes a difference!
Why does the T1 values change so much? Because there is changing concentrations of paramagnetic Cu(II) in there!
Typically NMR experiments involve a ‘recovery delay’- d1 on Bruker instruments – that is nominally set to 5 x T1 to ensure complete recovery of the magnetisation before the next scan.
If the delay is less than 5 x T1 then the relative signal integrals won’t be correct. This is why normally in a 1H NMR spectrum your peak integrals aren’t exactly 1.00 to 1.00 to 3.00 etc
Now normally for a diffusion NMR measurement you don’t care if you have short delays. As long as the T1 values stay constant during your measurement your diffusion measurement is fine.
But T1 values changing during your diffusion measurement is the same as having changing concentrations: it will mess up your diffusion measurement (...if those T1 changes are correlated with your applied gradients).
So…. Shuffle up your gradients!
We will soon submit a follow-up paper with all our raw data for everyone to see and would love any feedback anyone has! #NMRchat #research #diffusion #NMR
And finally, I'd like to encourage you all to read the authors response to our comment! https://science.sciencemag.org/content/371/6526/eabe8678

 Read on Twitter


