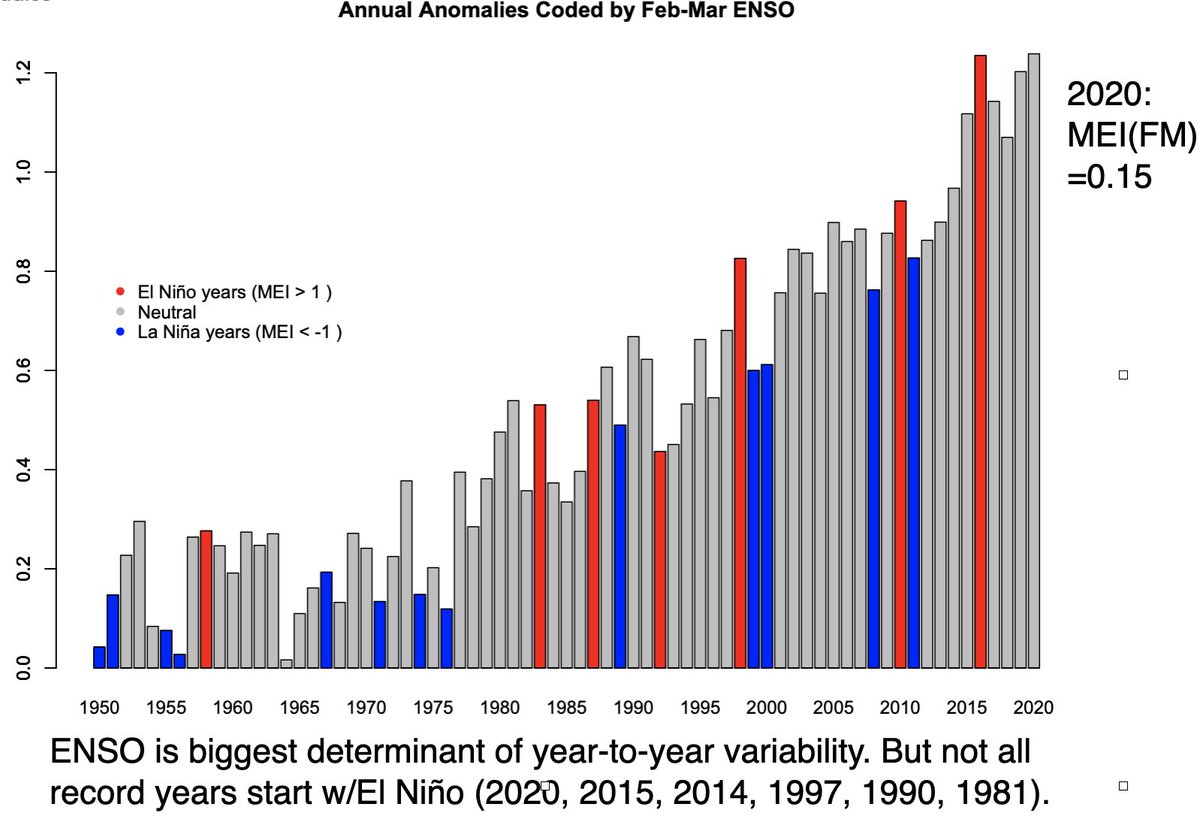
A bit more background on the temperature anomalies in 2020, which were statistically tied with 2016 for the warmest year in the instrumental record.
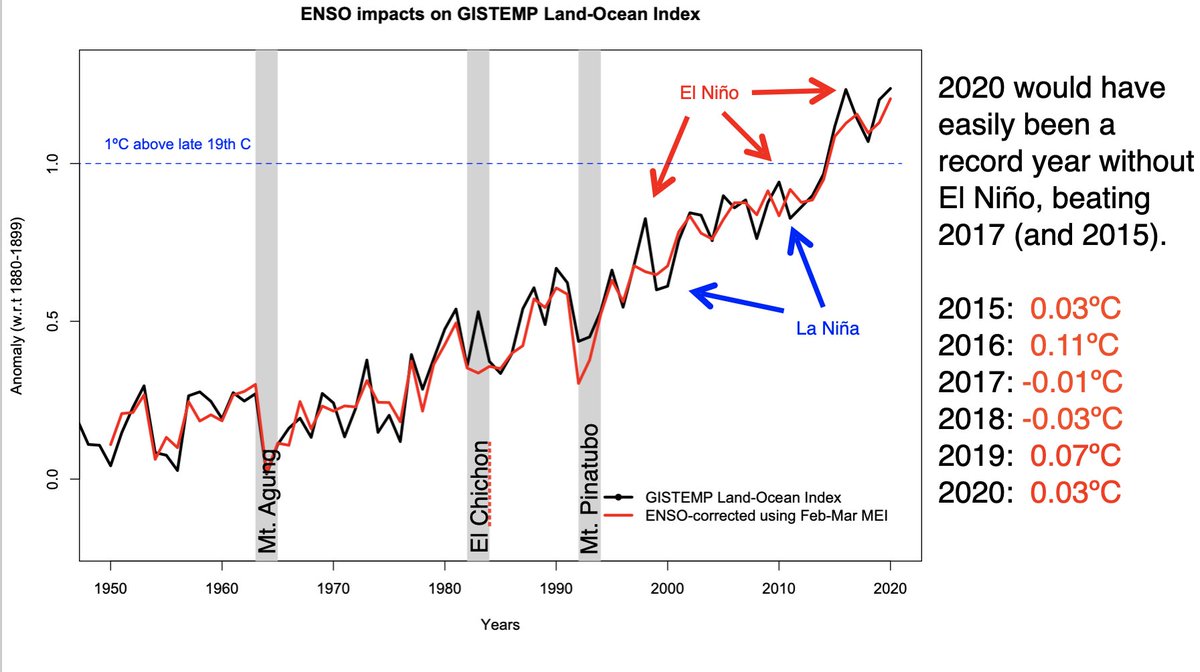
We can quantify the impact via regression to the Feb/Mar ENSO index and produce an 'ENSO corrected' temperature series that has a clearer long term trend (and volcanic impacts).
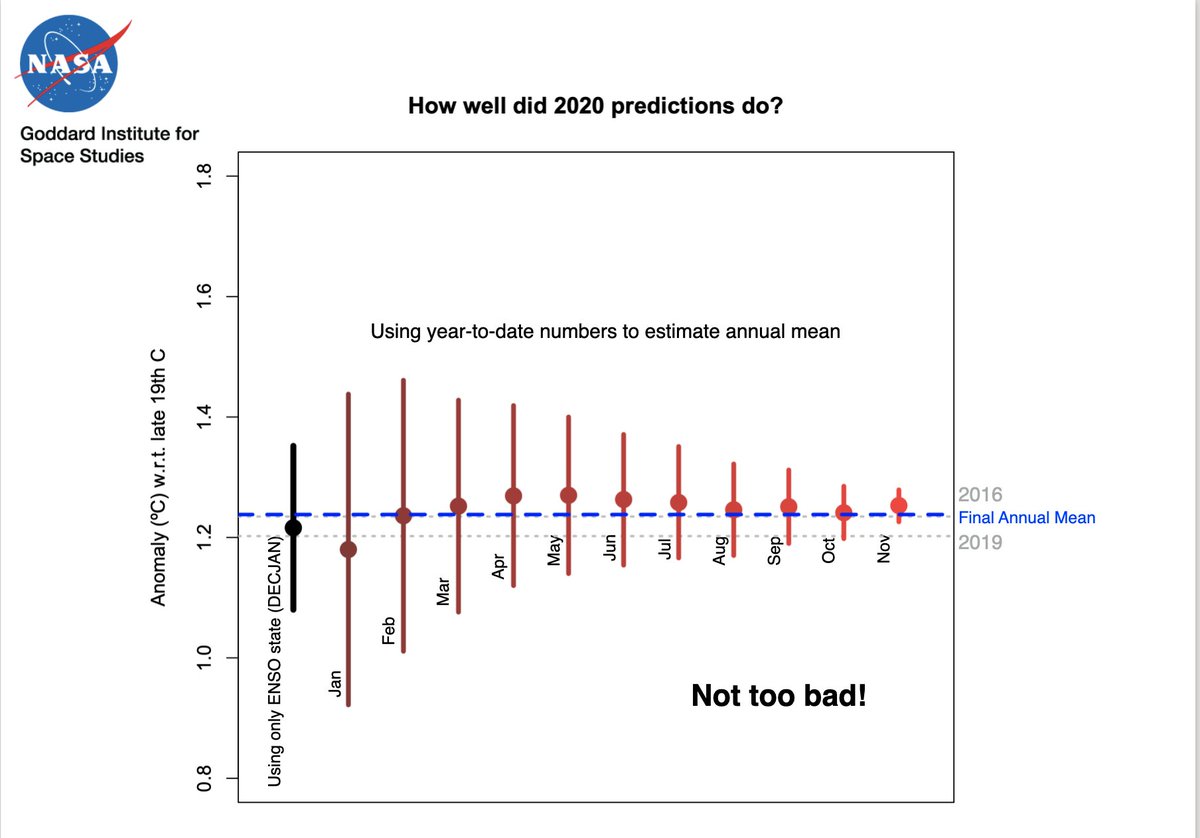
This dependence on winter/spring ENSO can be used to predict the annual temperatures a year ahead of time, and as the year progresses we can estimate the eventual annual number. How did we do?
How do the multiple indices stack up? Some very minor differences (getting smaller each year), but the same basic picture.
How robust is the ranking in a year like 2020? Not very - it's basically a toss-up - some groups (GISS, RSS) have #1, others #2. But in all cases the difference is much smaller than the estimated margin of error (~0.05ºC, 95% CI).
If anyone has any specific plots/analyses done, just let us know. Thanks!

 Read on Twitter


