Our State of the Climate 2020 is live! https://www.carbonbrief.org/state-of-the-climate-2020-ties-as-warmest-year-on-record
 Surface temps tied w/ 2016 as warmest
 Record high land temps
 Record ocean heat content
 1st or 2nd highest troposphere temps
 Record high GHGs
 Sea level
 Glaciers
 Sea ice
 Likely 2021 temps
(1)
 Surface temps tied w/ 2016 as warmest
 Record high land temps
 Record ocean heat content
 1st or 2nd highest troposphere temps
 Record high GHGs
 Sea level
 Glaciers
 Sea ice
 Likely 2021 temps
(1)
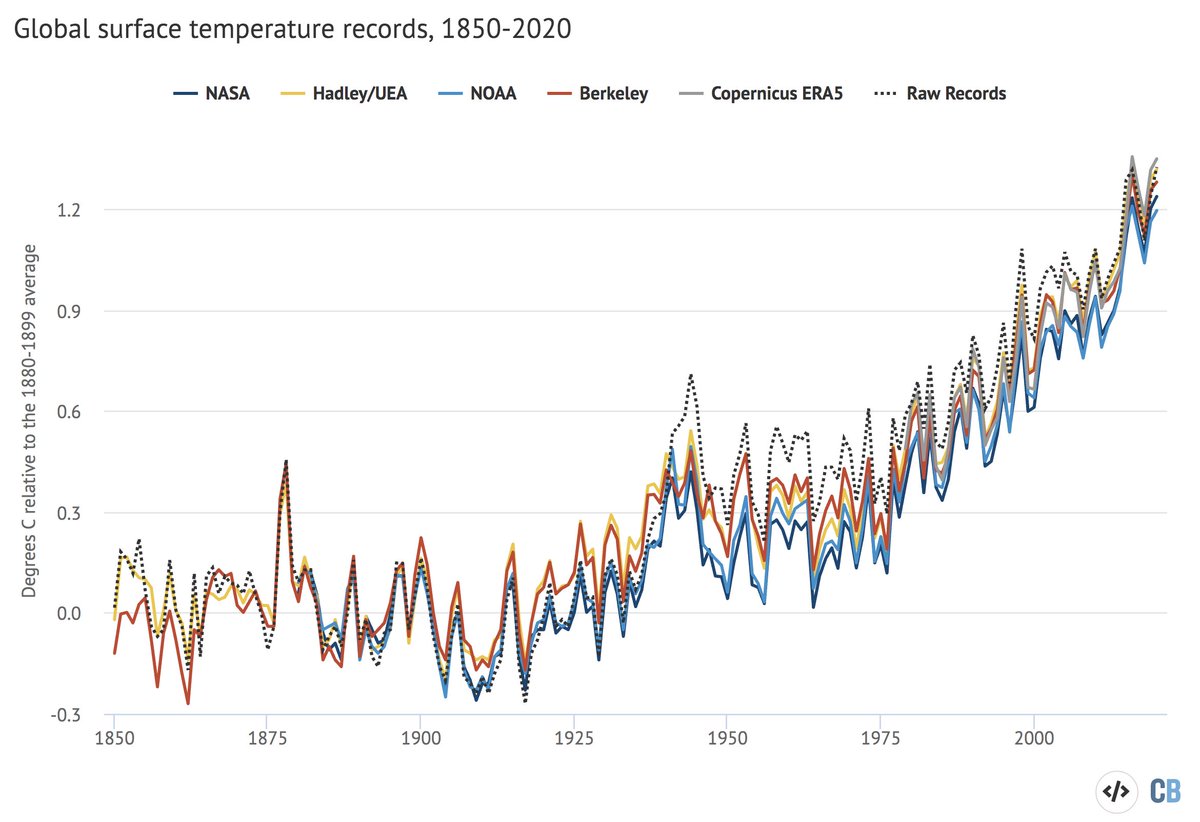
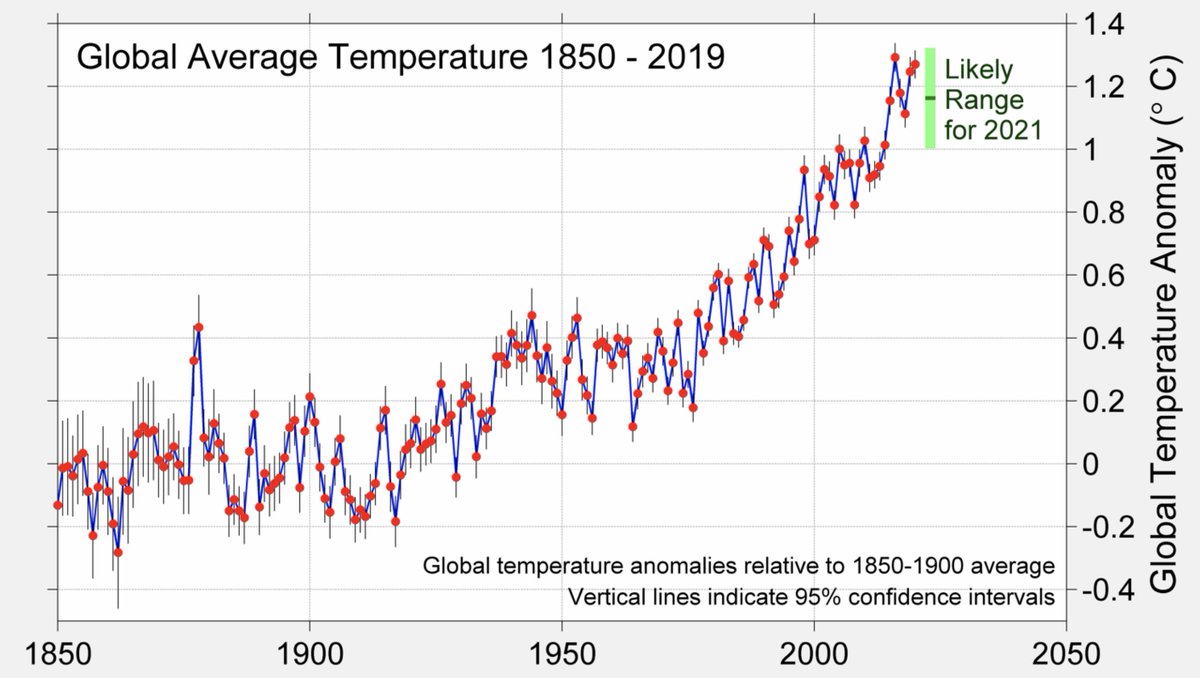
Global surface temps were between 1.2C and 1.3C above preindustrial levels across the various groups for 2020. NASA had it as the warmest, others have it as 2nd warmest, but in all cases the difference with 2016 (< 0.03C) is smaller than the measurement uncertainty (~0.05C): (2)
We also include a raw temp record based on GHCNv4 land data and ICOADS (HadSST3 raw) ocean data (black dashed line). It shows similar warming to preindustrial, and that warming since preindustrial does not depend on adjustments to the data. (3) https://www.carbonbrief.org/explainer-how-data-adjustments-affect-global-temperature-records
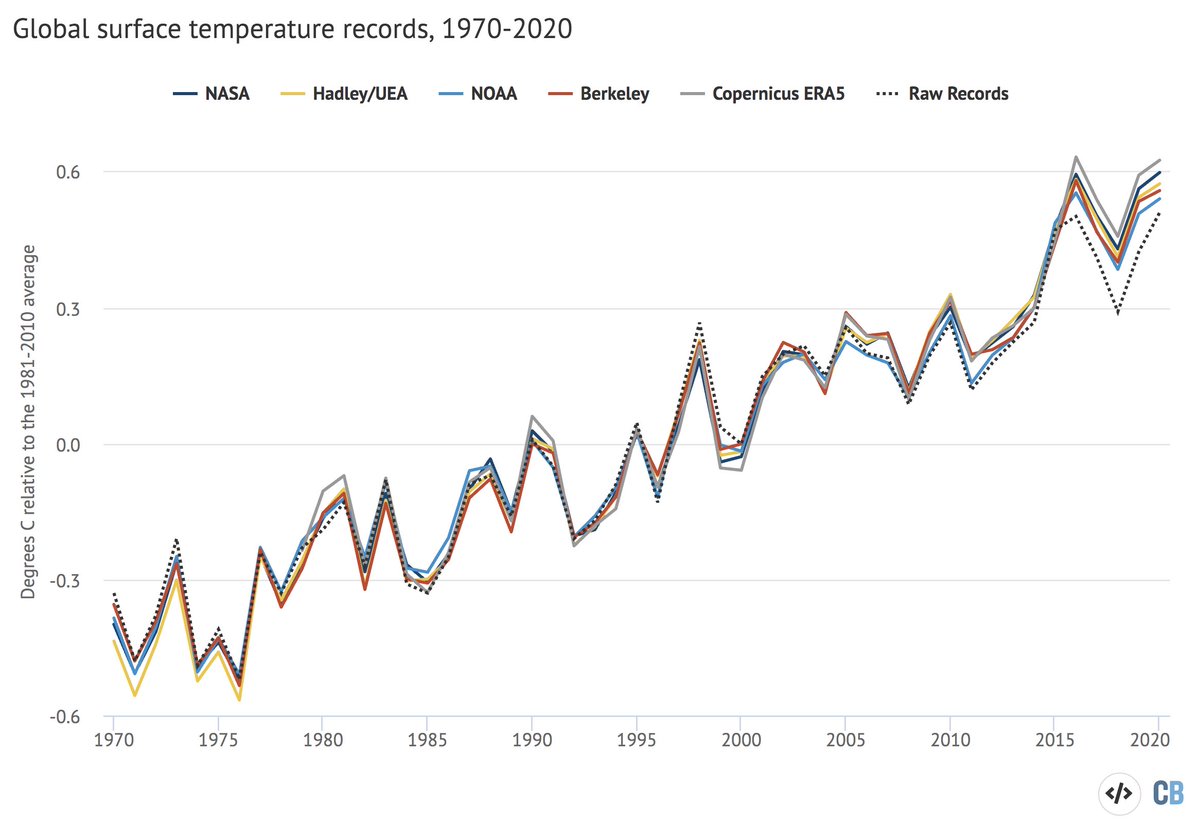
If we zoom in on 1970-2020 period, we see strong agreement between most surface records in recent decades. Note that in this SotC we've replaced HadCRUT4 with new HadCRUT5 dataset and retired Cowtan & Way (which is substantially similar to HadCRUT5): https://www.carbonbrief.org/analysis-why-the-new-met-office-temperature-record-shows-faster-warming-since-1970s (4)
The past 6 years (2014-2020) really stand out as notably warmer than any prior years. This figure from @RARohde shows the Berkeley Earth 2020 results and its uncertainty (represented by the bell curve) compared to other years: (5)
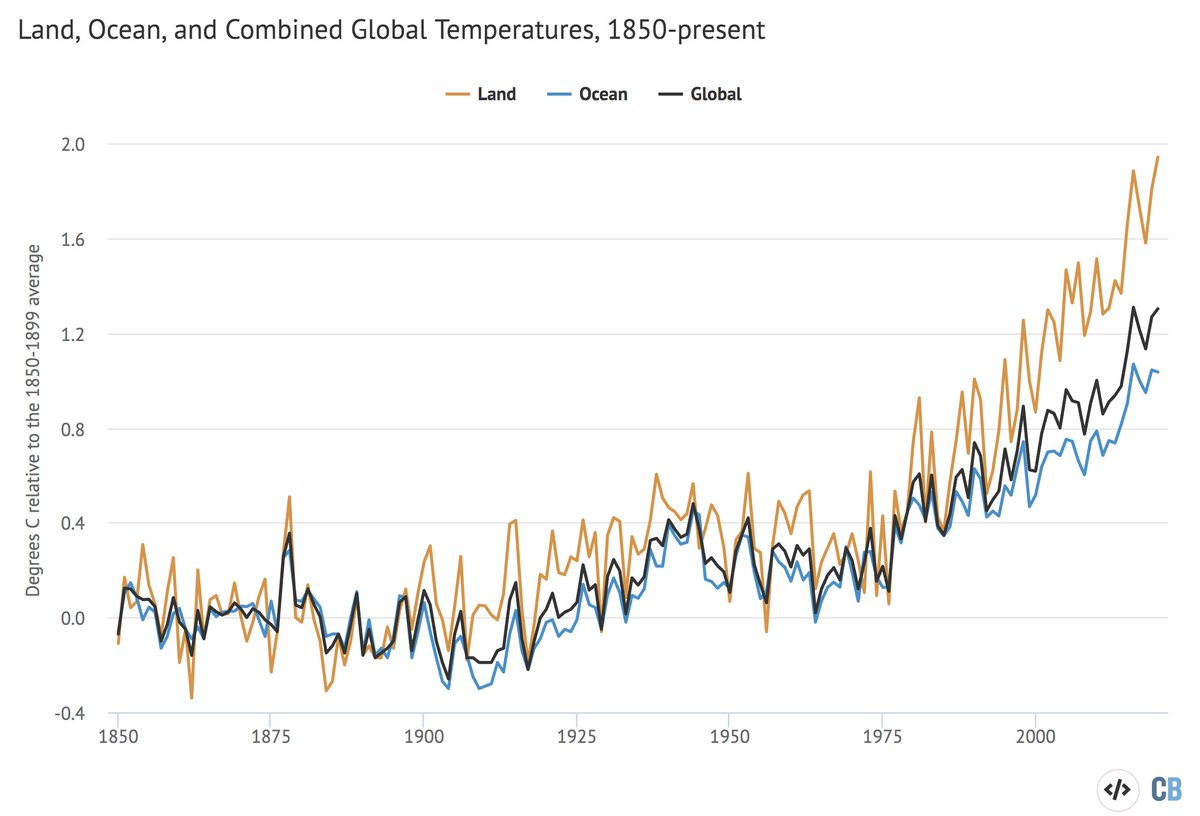
Global temps obscure larger regional changes. For example, while the globe as a whole has warmed by around 1.2C to 1.3C, land areas have warmed close to 2C and oceans only 1C since preindustrial times: (6)
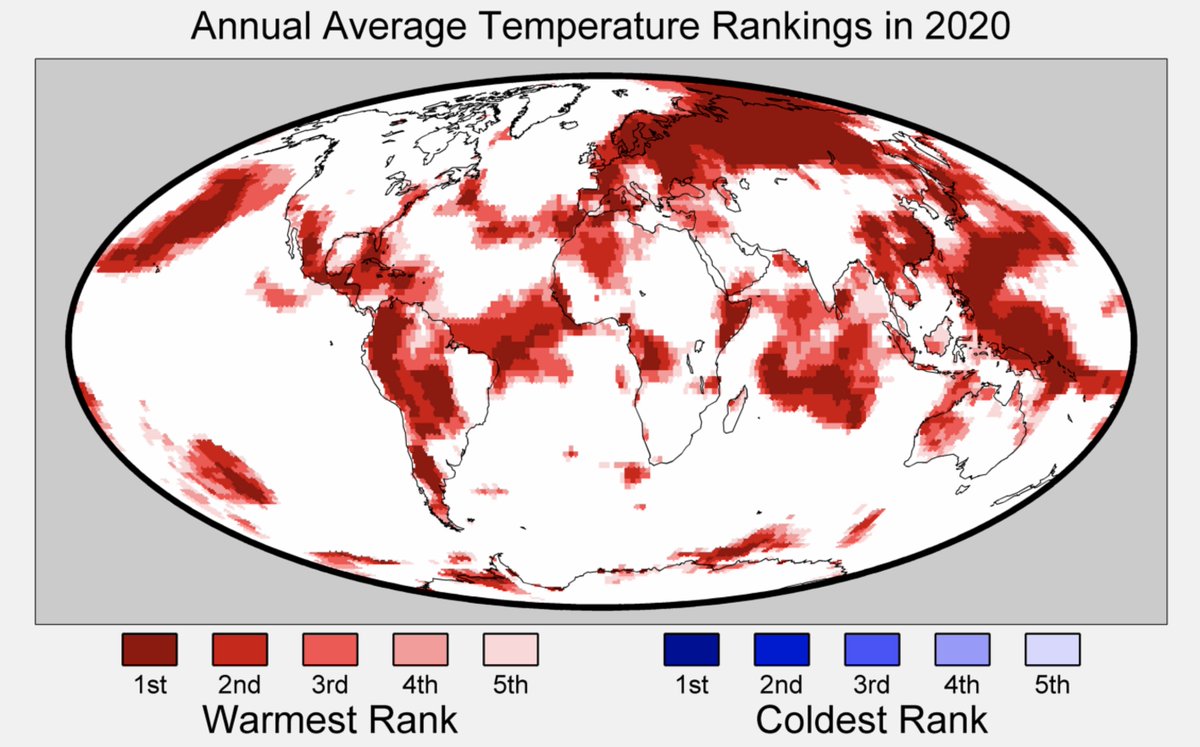
Some parts of the world were much warmer in 2020 than others; we saw particularly high temperatures in the Arctic, over Siberia, Europe, Central and South America, the Middle East, the northern Pacific Ocean and the Antarctic Ocean: (7)
A sizable portion of the Earth's surface saw record warm temperatures, while no location on Earth saw record cold (or even top 5 cold conditions) for the year as a whole: (8)
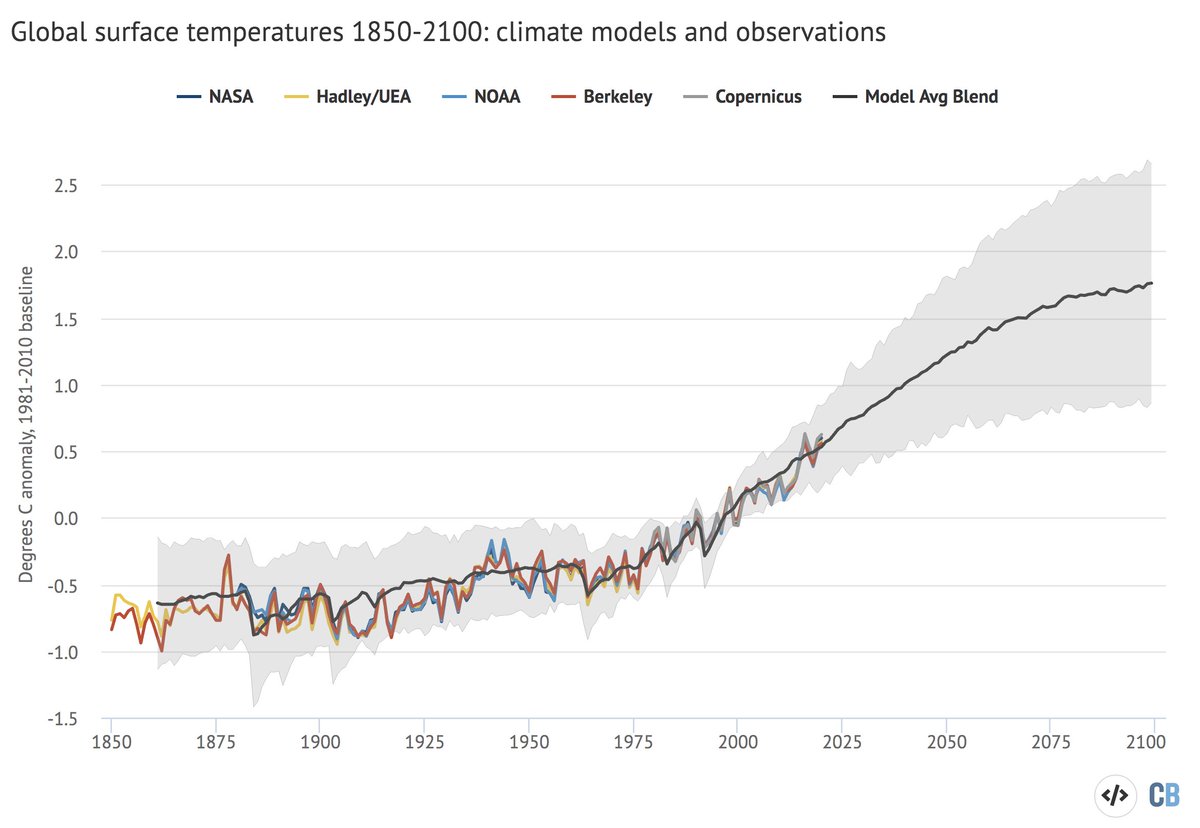
Surface temperatures were pretty dead on in climate model projections in 2020. Here are results from the last generation of climate models (CMIP5) for 1850-2100, along with observations (colored lines): (9)
The climate model fields used here are "blended"; that is, they combine surface air temps over land with sea surface temps over the oceans to mimic the way we take observations. If we just use surface air temps models are a bit warmer in recent years: (10)
We also have a new generation of climate models – CMIP6 – that are being run. Using the 33 models currently available (for historical and SSP2-4.5) we can compare observations and CMIP6 models (note that blended CMIP6 fields are not yet available): (11)
CMIP6 models are on average running a tad warmer than observations in recent years, likely reflecting the higher climate sensitivity of some of the models compared to CMIP5. For more on these new climate models, see our Carbon Brief explainer: https://www.carbonbrief.org/cmip6-the-next-generation-of-climate-models-explained (12)
The two lower troposphere temperature records (e.g. ~5 km up in the atmosphere) show 2020 as the warmest (RSS) and second warmest (UAH) on record. Note that El Nino and La Nina conditions tend to amplify troposphere temps more than on the surface: (13)
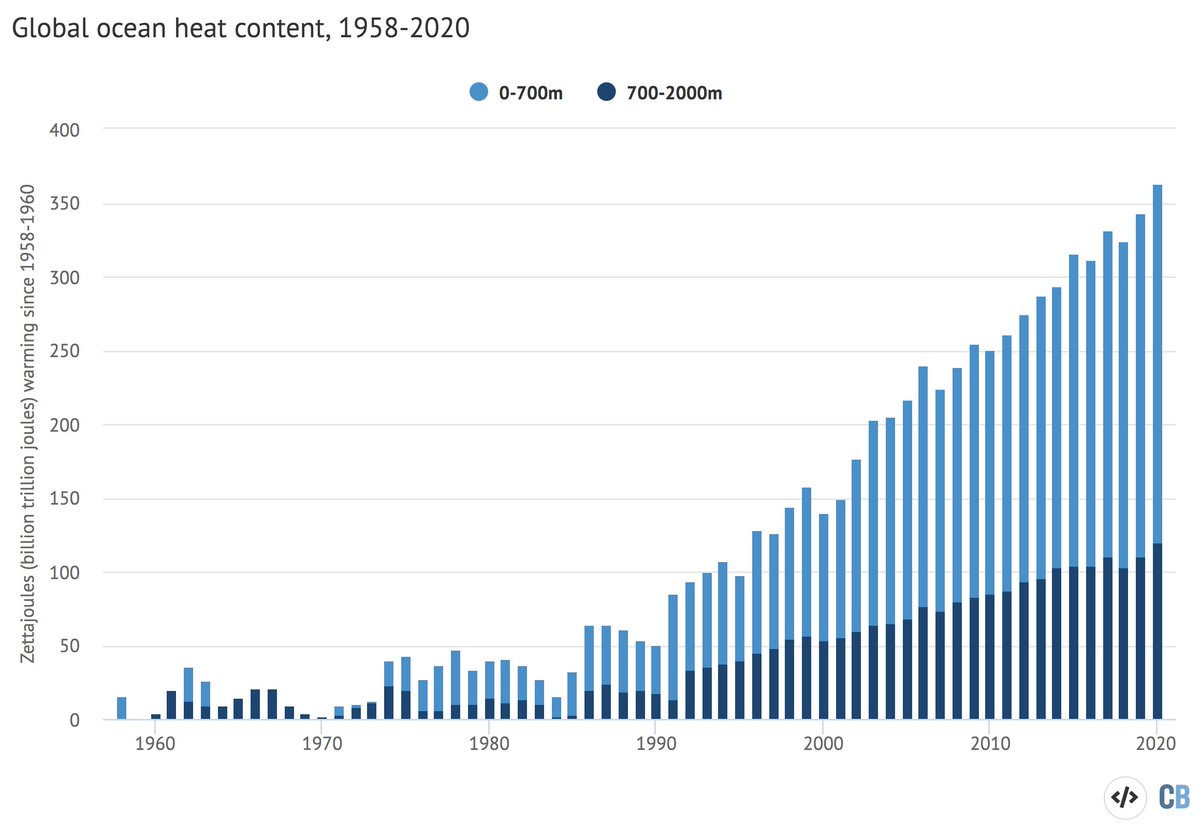
Ocean heat content set a new record in 2020. More than 90% of heat trapped by greenhouse gases accumulated in oceans, and unlike atmosphere (which is more variable) nearly every year on the oceans set a new record. Most heat has accumulated in the upper (0-700m) ocean. (14)
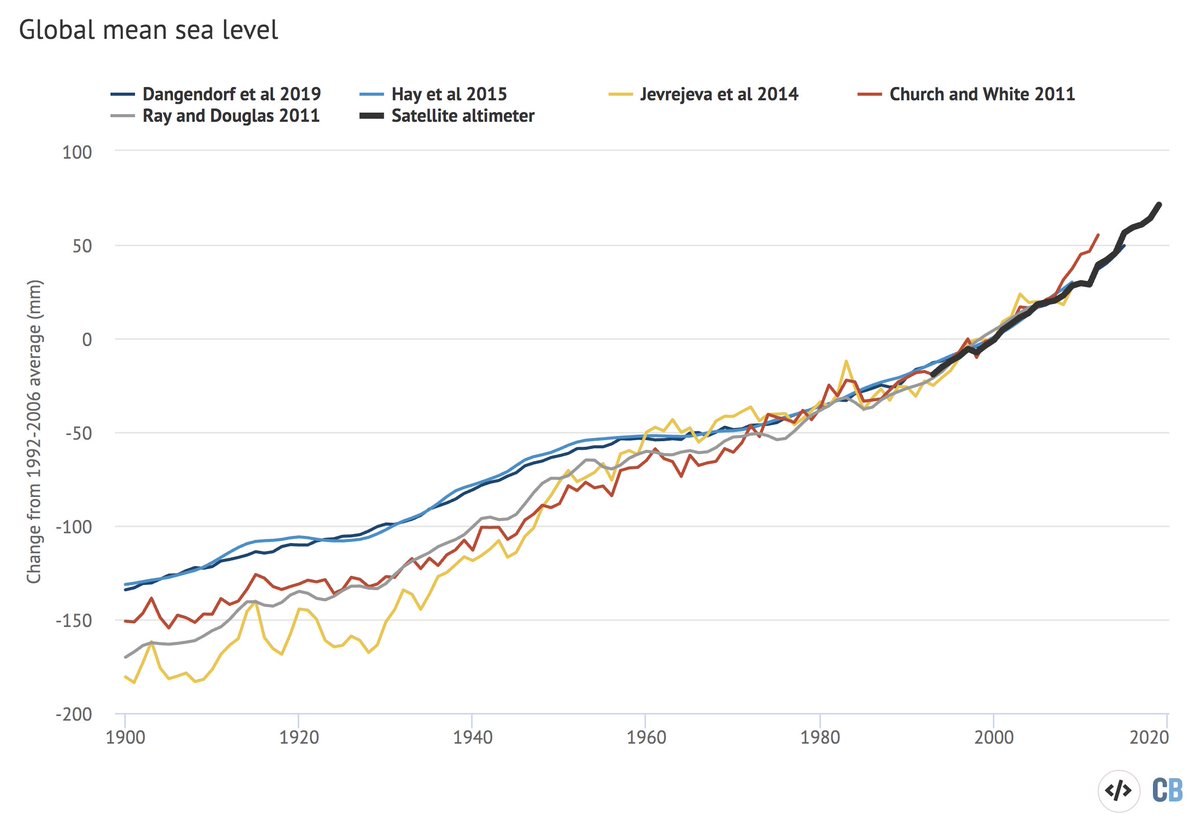
Sea level rise continues upward, with nearly every year seeing higher sea levels. There is evidence that sea level rise is accelerating, driven by melting glaciers and ice sheets. Note that data is not yet available to the end of 2020, so this figure goes through 2019. (15)
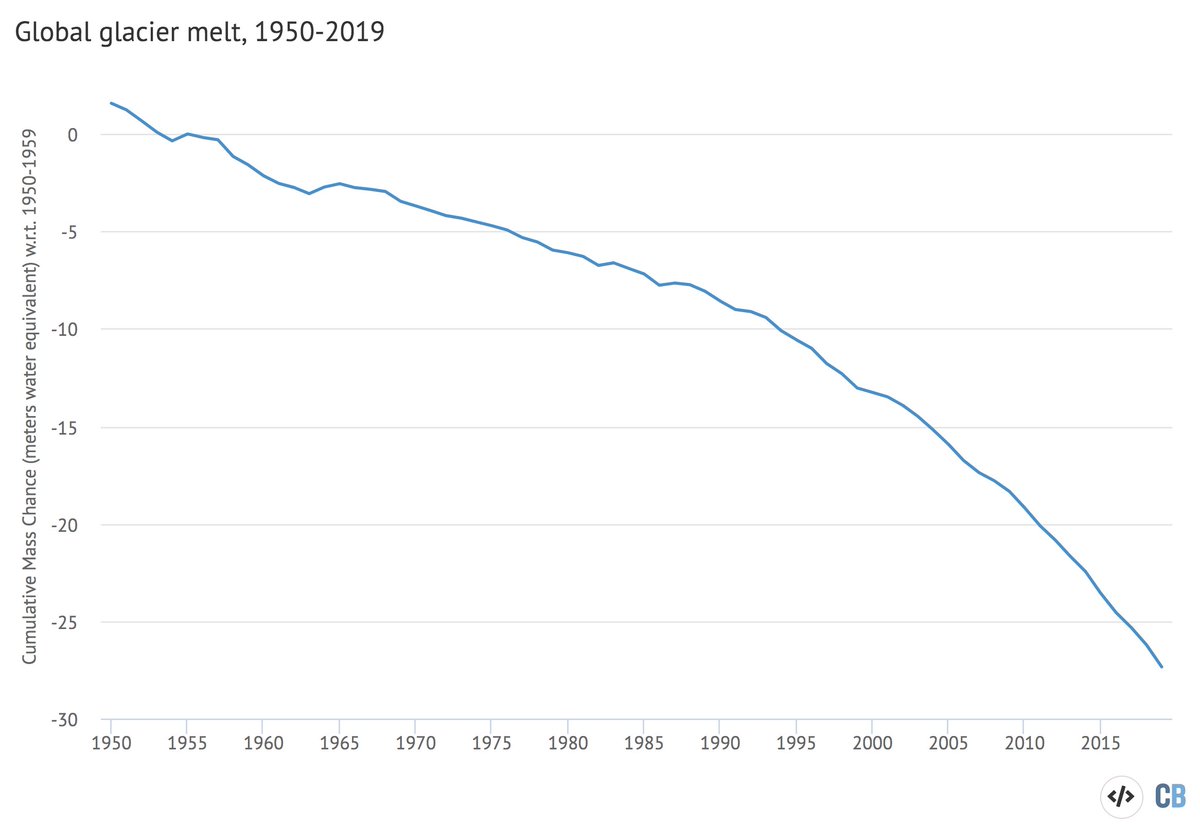
Global glacier mass loss continues, and has accelerated in recent years. Similar to the sea level figure, this one only goes through the end of 2019 as full 2020 data is not available yet. (16)
Atmospheric GHG concentrations (CO2, CH4, N2O) all reached record levels in 2020 despite some emissions reductions due to COVID-19. Because they accumulate in the atmosphere, a single yearly reduction in emissions will not cause concentrations to fall: (17)
Arctic sea ice was at record low daily levels for much of the summer in 2020. The summer minimum (lowest point of the year) was the second lowest on record after 2012: (18)
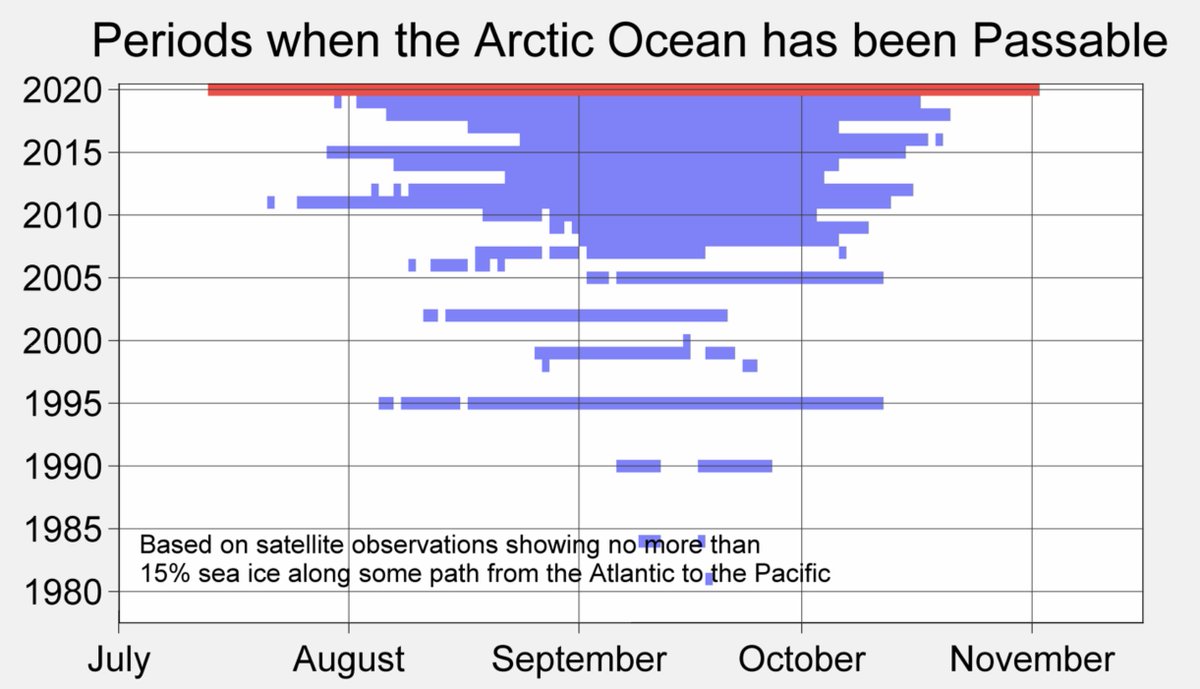
As a result, the Northeast Passage was open for shipping in 2020 for longer than any other year: (19)
The fact that 2020 was tied as the warmest year on record is all the more remarkable given that the prior record (2016) was a super El Nino year, while 2020 had a modest La Nina event in the second half of the year (20)
La Nina tends to result in cooler global temps, and likely contributed to a bit cooler conditions over the past few months. However, the largest effect of current La Nina conditions will be felt in 2021, which various groups expect to be cooler than 2020: (21)
What matters for the climate is not the leaderboard of individual years. Rather, it is the long-term upward trend in global temperatures driven by human emissions of greenhouse gases. Until the world reduces emissions down to net-zero, the planet will continue to warm. (22)

 Read on Twitter