1. Some topline thoughts/charts on $BTC taken from my analysis to subscribers last+this week.
As mentioned before the event, $BTC needed a pullback/slowdown as several indicators were signalling the RATE at which had price appreciated was too extreme to keep going much longer.
As mentioned before the event, $BTC needed a pullback/slowdown as several indicators were signalling the RATE at which had price appreciated was too extreme to keep going much longer.
2. GR Multiplier: Price has now pulled back below the x3 multiple where I expect it to stay for a while.
As others have spoken about, price likely ran up to x3 (beyond x2) because we've had an earlier mania phase in the cycle vs last cycle with both retail+institutions buying.
As others have spoken about, price likely ran up to x3 (beyond x2) because we've had an earlier mania phase in the cycle vs last cycle with both retail+institutions buying.
3. Advanced NVT: Looks at mkt cap vs network activity.
It was showing that price had outstretched network activity in the short-medium term and needed to pullback. Now already returning to more sustainable levels after the past couple of days
It was showing that price had outstretched network activity in the short-medium term and needed to pullback. Now already returning to more sustainable levels after the past couple of days

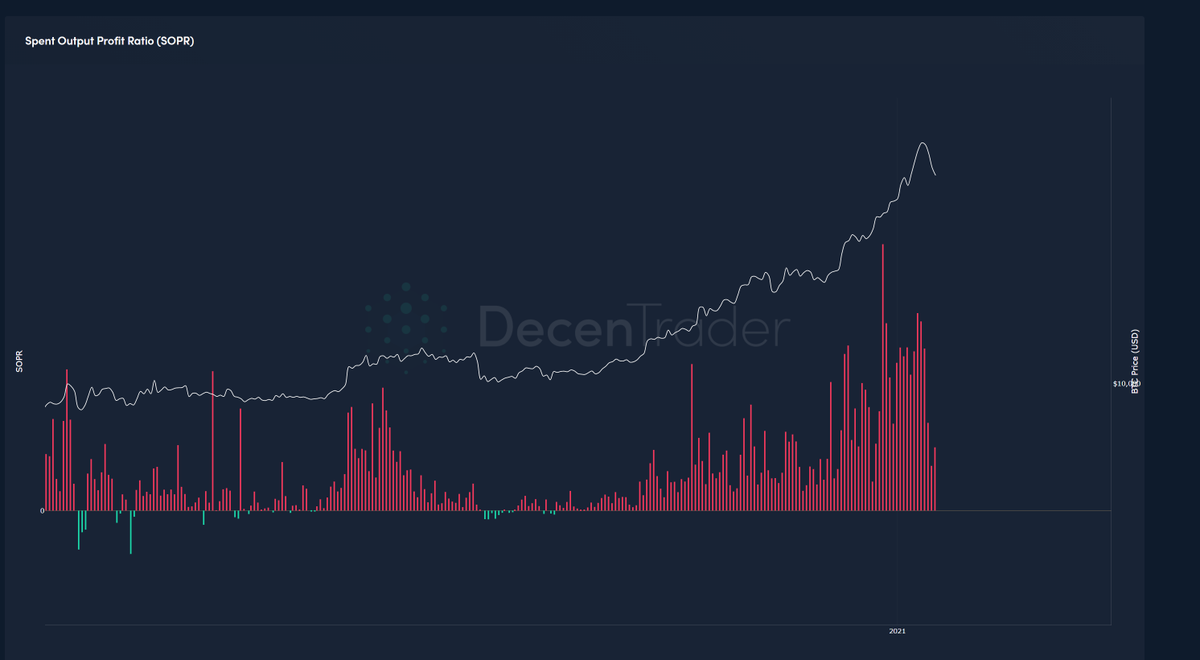
4. Spent output profit ratio (SOPR) looks at whether wallets are in profit or loss.
After getting far too extended, levels now returning to normal. Let's see if we get a 'buy the dip' signal with the indicator painting a green bar. Would require a further dip at some point.
After getting far too extended, levels now returning to normal. Let's see if we get a 'buy the dip' signal with the indicator painting a green bar. Would require a further dip at some point.
5. Whales are continuing to accumulate bitcoin as can be seen here with the parabolic rise in the number of wallets holding at least 1,0000 bitcoin since Christmas. 
Don't let them shake you out!
This and other data makes it less likely we continue down IMO.

Don't let them shake you out!
This and other data makes it less likely we continue down IMO.
6. Sideways/up more likely in near term IMO but perhaps at a slower rate than we have seen over the past couple of months as some money/profit rotates into altcoins.
I think we are already starting to see that with DeFi over past 48hrs.
To learn more: http://decentrader.com
I think we are already starting to see that with DeFi over past 48hrs.
To learn more: http://decentrader.com

 Read on Twitter


