1/29 #Bitcoin  thread, updated version
We’ve doubled since the last time I updated this thread, so I thought it would be of some value to update it. Feeling insecure about price action? Too enthusiastic/scared? Maybe this helps a bit, go check it out!
TLDR at 27-29
Let’s go!
 thread, updated version
We’ve doubled since the last time I updated this thread, so I thought it would be of some value to update it. Feeling insecure about price action? Too enthusiastic/scared? Maybe this helps a bit, go check it out!
TLDR at 27-29
Let’s go!

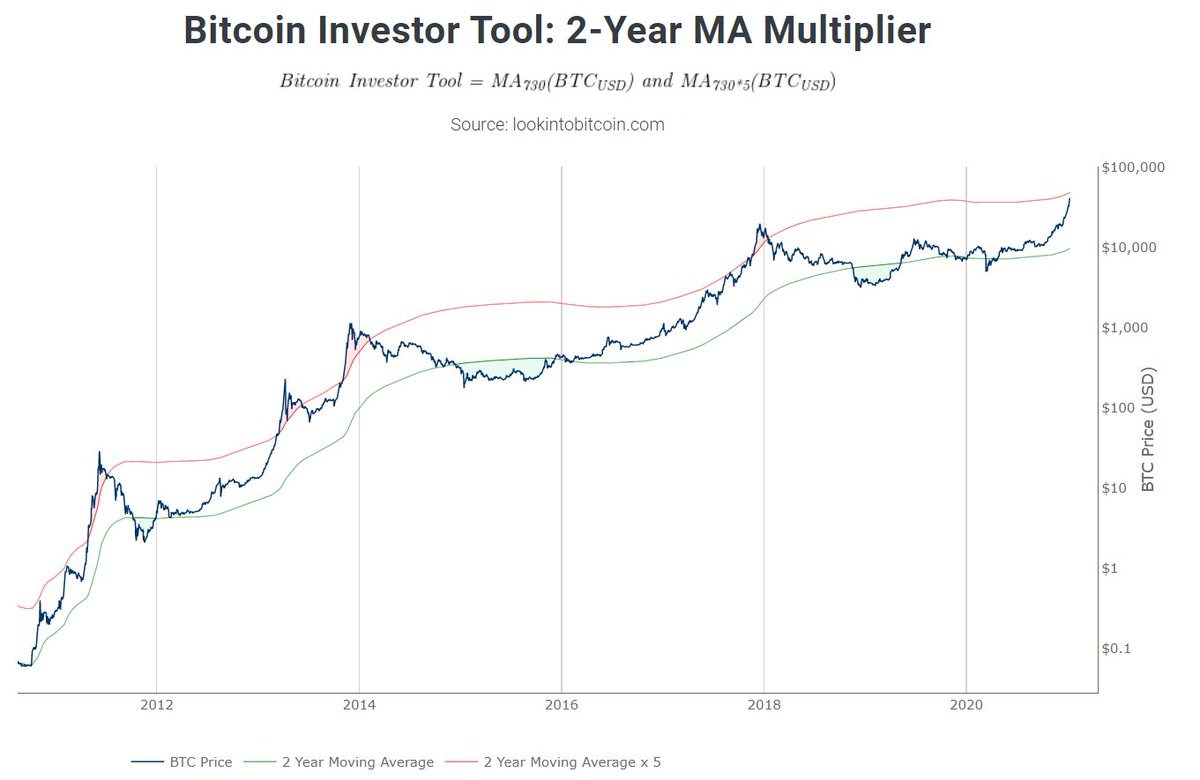
2/ 2 Year MA Multiplier
This indicator uses the 2Y MA. Green line is the 2Y MA, red is the same MA x5
2ya MA multiplier is rising and at ~48k rn. Price goes parabolic. I would personally love to get a decent correction, would give more space for growth long term imho.
This indicator uses the 2Y MA. Green line is the 2Y MA, red is the same MA x5
2ya MA multiplier is rising and at ~48k rn. Price goes parabolic. I would personally love to get a decent correction, would give more space for growth long term imho.
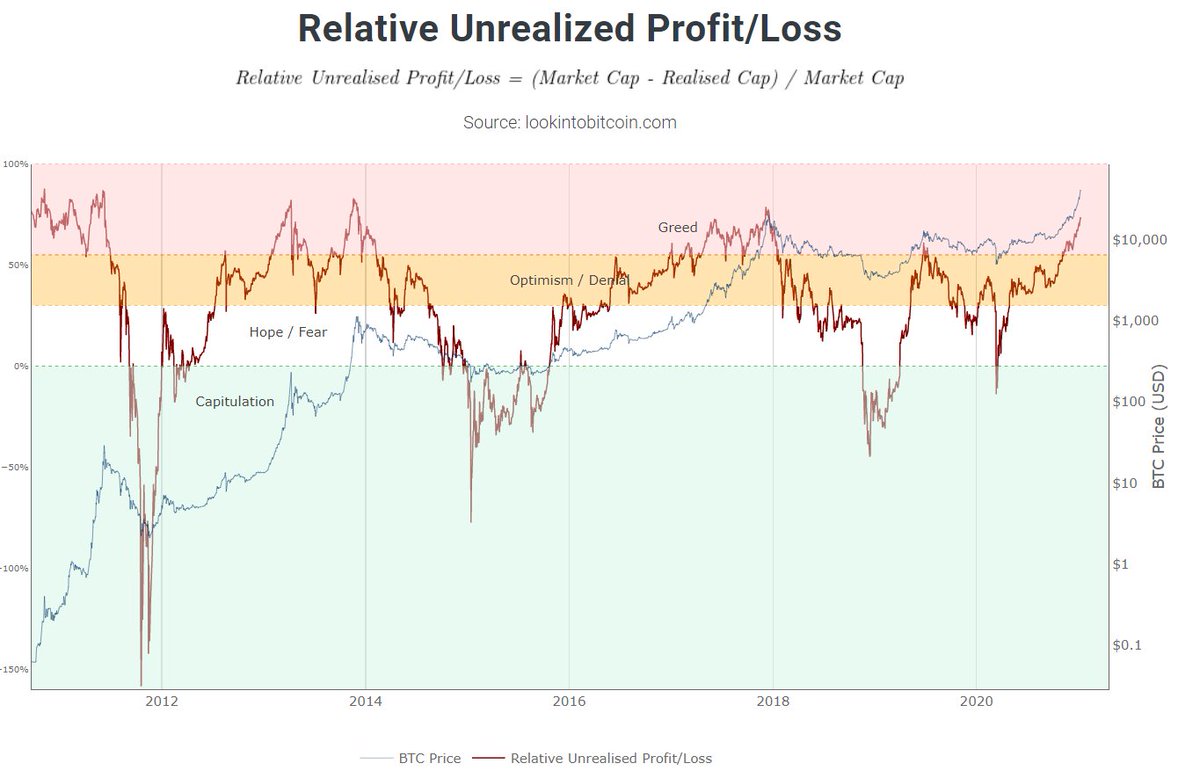
3/ Relative Unrealized P/L
Paper p/l in $Btc. Use it to track investor sentiment.
Market is overheating, everybody is in paper profits, but as you can see “we” as a whole take too less profit. We can stay around greed for a whole year, but a correction at this point makes sense
Paper p/l in $Btc. Use it to track investor sentiment.
Market is overheating, everybody is in paper profits, but as you can see “we” as a whole take too less profit. We can stay around greed for a whole year, but a correction at this point makes sense
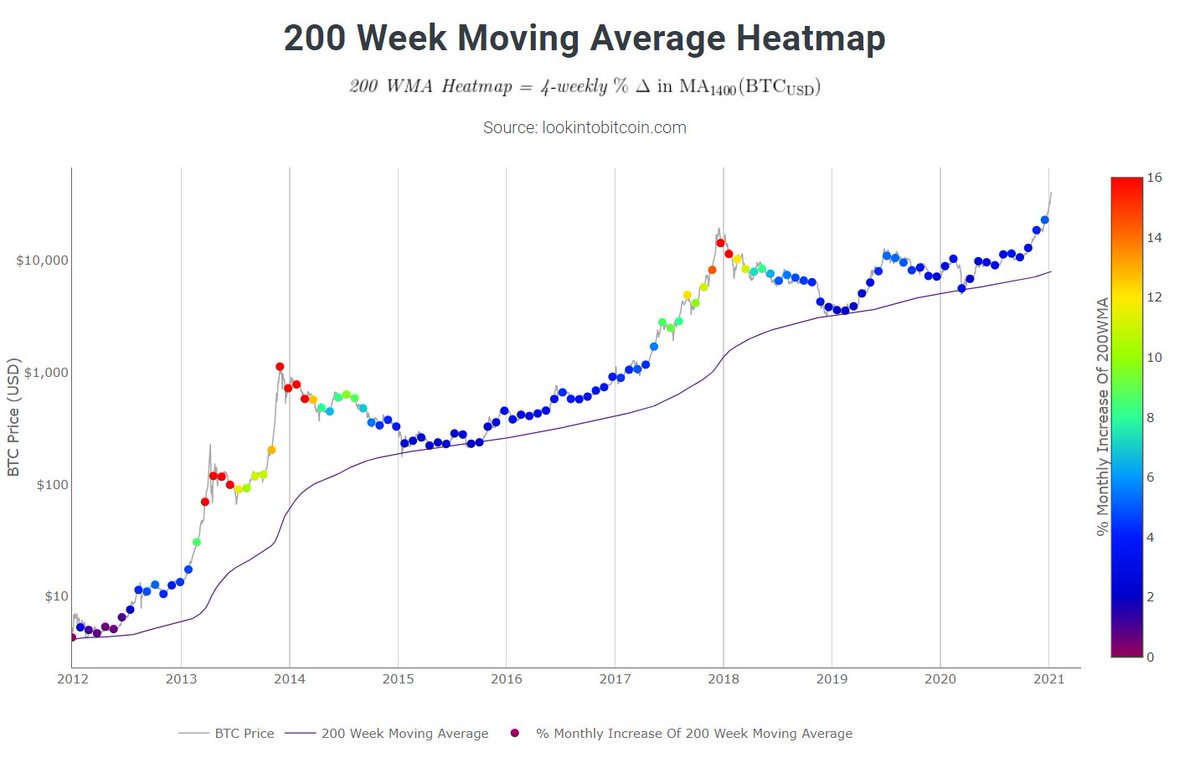
4/ 200 Week MA Heatmap
#Bitcoin likes to bottom out near the 200W MA
Colors are attached to % increase of MA
Blue/purple = Buying opportunity
Orange/red = TP opportunity
The bigger the distraction, the more parabolic price goes, simply said
First green coming(?) Room for growth
#Bitcoin
 likes to bottom out near the 200W MA
Colors are attached to % increase of MA
Blue/purple = Buying opportunity
Orange/red = TP opportunity
The bigger the distraction, the more parabolic price goes, simply said
First green coming(?) Room for growth
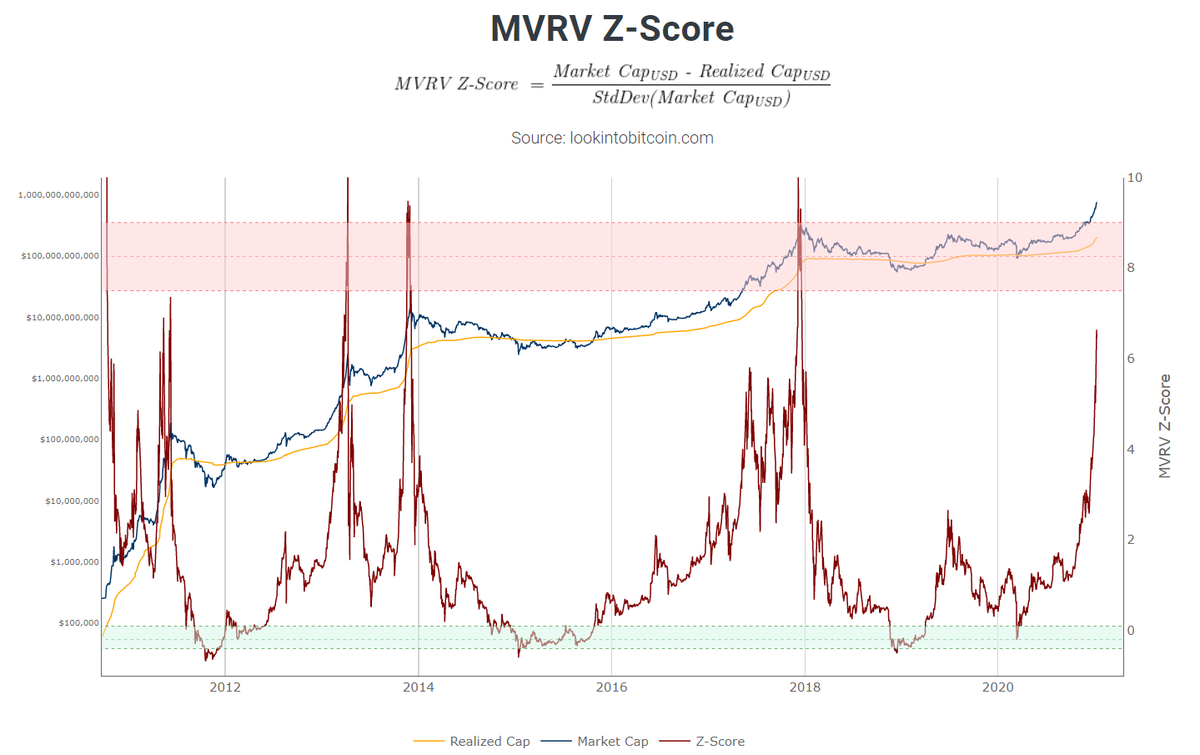
5/ MVRV Z-score.
To identify periods when $Btc is extremely under/overvalued.
Green= MV unusually far below RV, buying opp
Red=MV unusually high above RV, TP opp.
Now: heating up. Correction first to cool it off plz :)
Nice uptick in realized value.
To identify periods when $Btc is extremely under/overvalued.
Green= MV unusually far below RV, buying opp
Red=MV unusually high above RV, TP opp.
Now: heating up. Correction first to cool it off plz :)
Nice uptick in realized value.
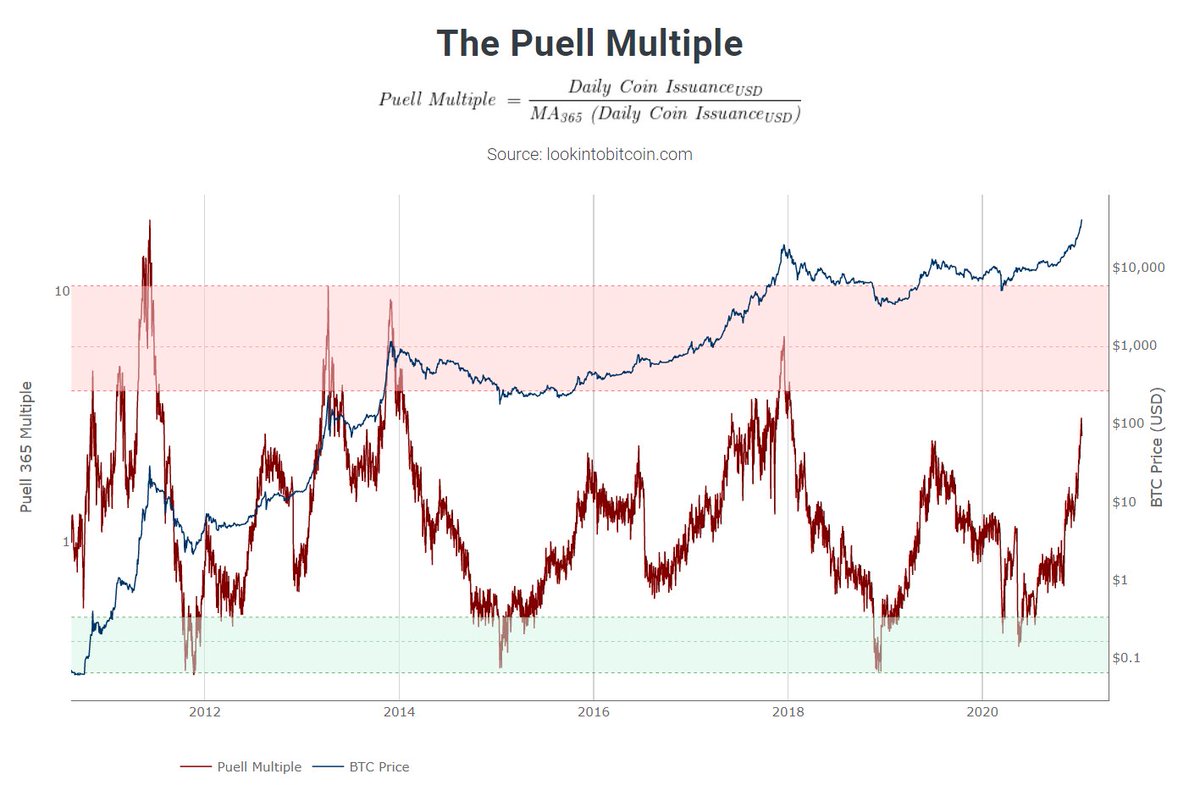
6/ Puell Multiple
It’s about value of #Bitcoins being mined and entering the ecosystem.
Green: Value of Bitcoins being issued is extremely low. Buy here
Red: The opposite. Sell here
Now: We are in bull mode and that’s great, but again would love correction to cool it off
It’s about value of #Bitcoins being mined and entering the ecosystem.
Green: Value of Bitcoins being issued is extremely low. Buy here
Red: The opposite. Sell here
Now: We are in bull mode and that’s great, but again would love correction to cool it off
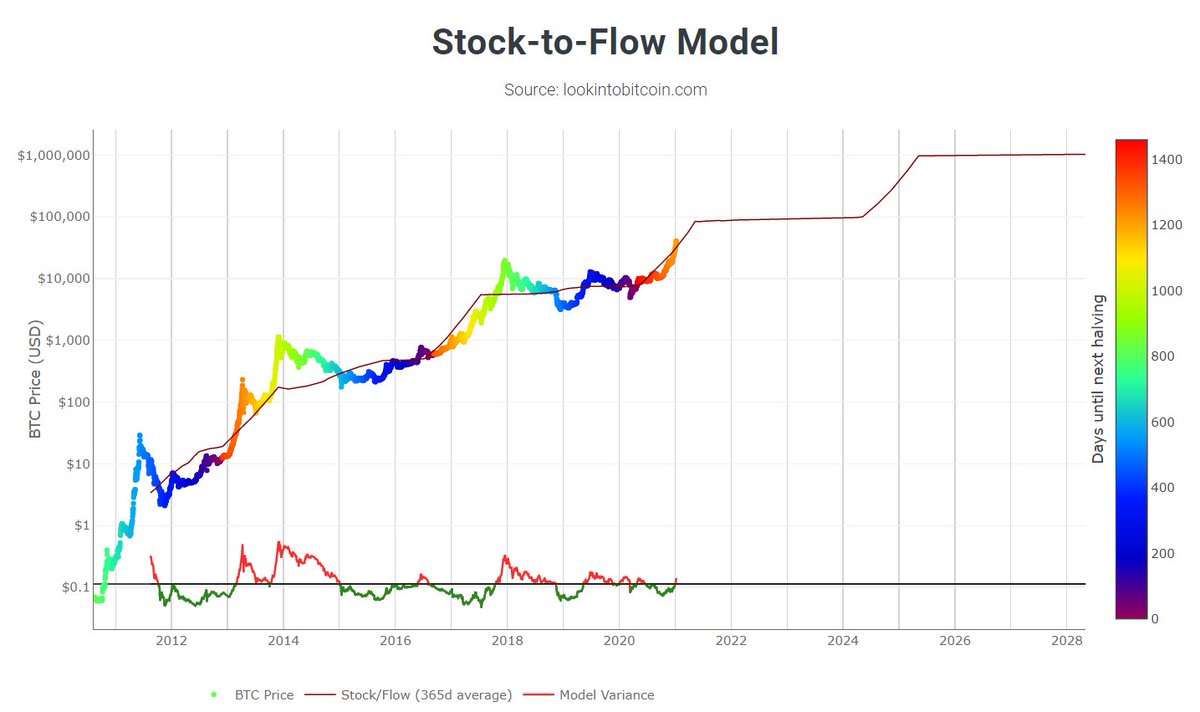
7/ Stock to flow model
Hated & Loved on #CT
Simply put: $Btc is scarce, limited supply. More demand, less flow (halvening): Number goes up.
100k is closer than you think :), but overextended short term, so: correction, sideways and next leg up towards 6 figures plz

Hated & Loved on #CT
Simply put: $Btc is scarce, limited supply. More demand, less flow (halvening): Number goes up.
100k is closer than you think :), but overextended short term, so: correction, sideways and next leg up towards 6 figures plz


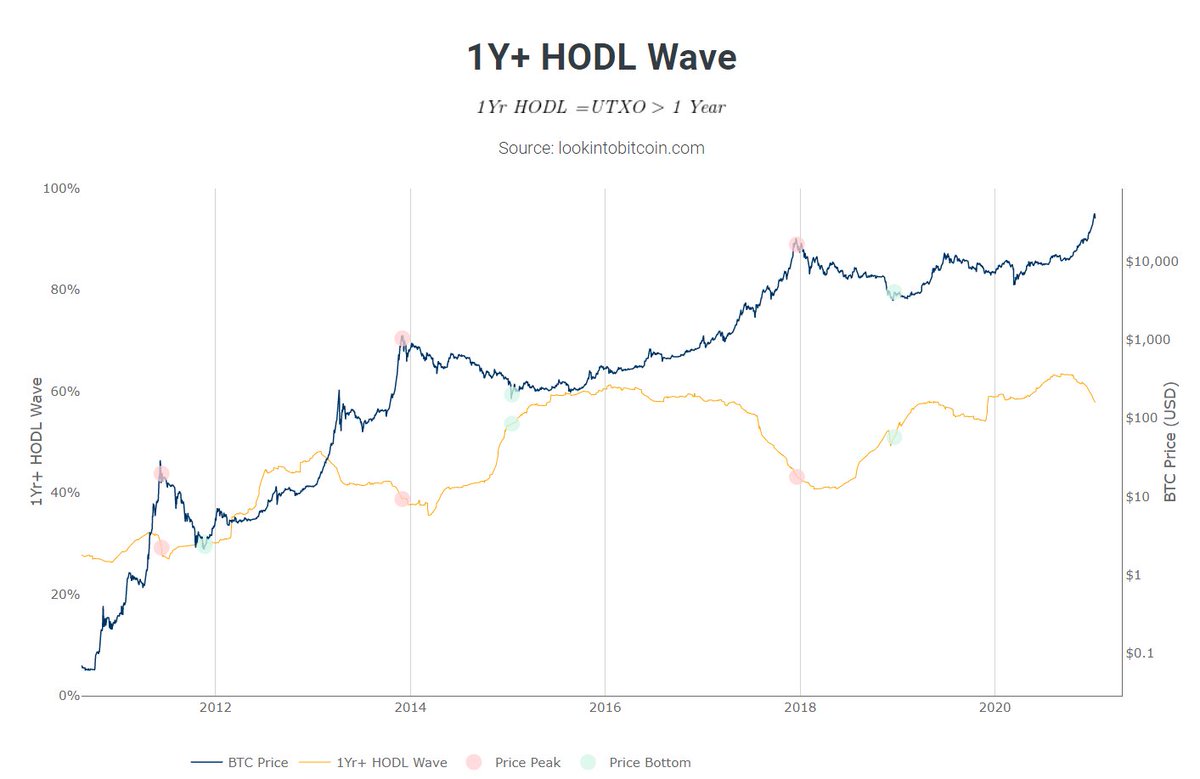
8/ 1Y+ Hodl Wave
#Bitcoins that haven’t moved for more than 1 year. If $Btc goes parabolic, 1Y+ decreases, because there is profit taking. Notice how 1Y+ Hodl went down whole 2017
Right now there is some decent profit taking going on. Makes sense, after a 10x from march, right?
#Bitcoins that haven’t moved for more than 1 year. If $Btc goes parabolic, 1Y+ decreases, because there is profit taking. Notice how 1Y+ Hodl went down whole 2017
Right now there is some decent profit taking going on. Makes sense, after a 10x from march, right?
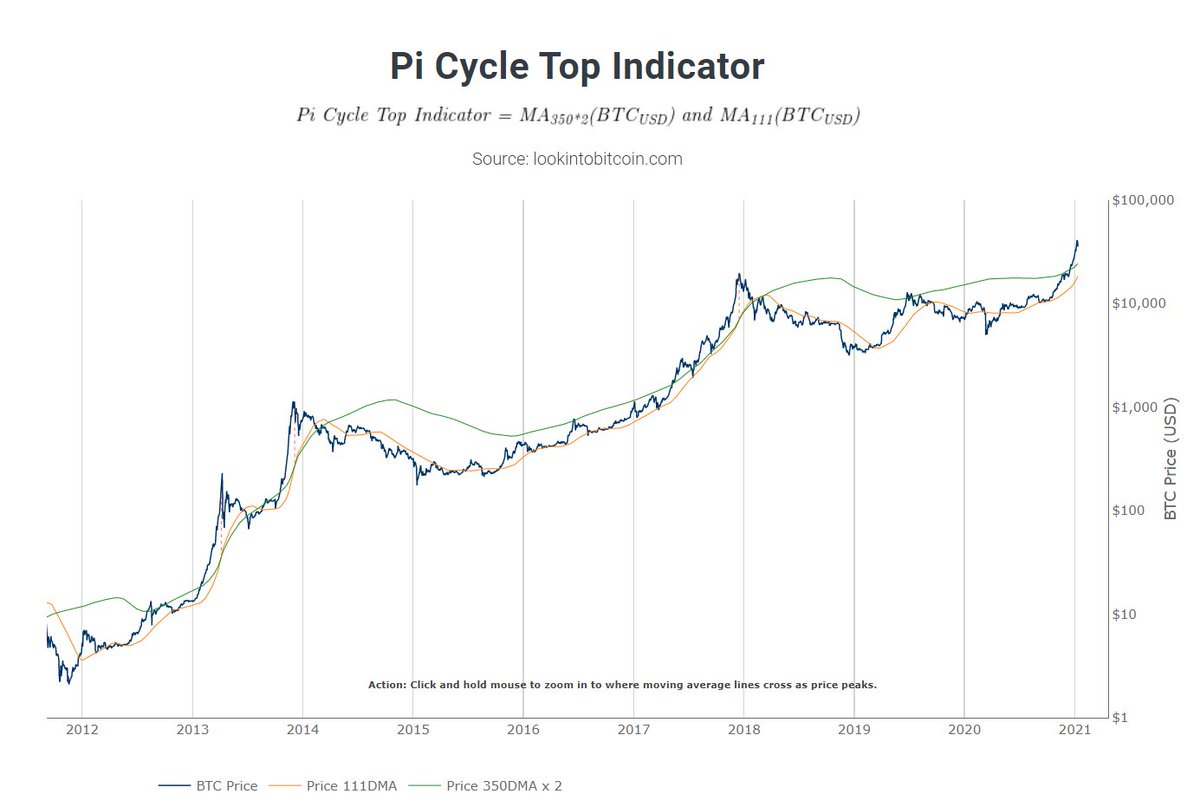
9/ Pi cycle top indicator
Has historically “called” the top of a full bull market cycle high to within 3 days! It uses 2 not so common MA’s.
Usefull to indicate whether the market is very overheated.
A correction here makes perfect sense. Htf top not in, imho (and indicator )
)
Has historically “called” the top of a full bull market cycle high to within 3 days! It uses 2 not so common MA’s.
Usefull to indicate whether the market is very overheated.
A correction here makes perfect sense. Htf top not in, imho (and indicator
 )
)
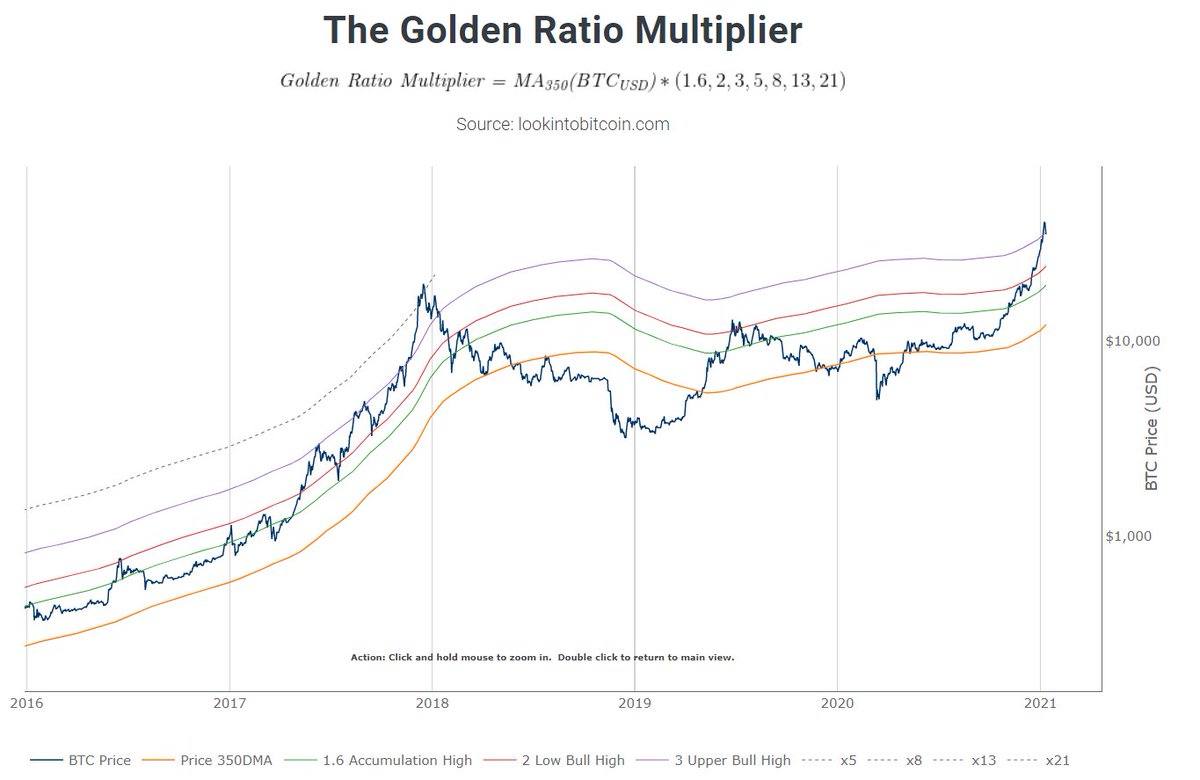
10/ The Golden Ratio Multiplier
Uses GR multiples of the 350 DMA to pick (intra)cycle highs of the price of $Btc
As #Btc becomes adopted over time, explosive growth on log scale is slowing
Shoot up hard, touched upper multiple. A correction before next leg up makes sense to me
Uses GR multiples of the 350 DMA to pick (intra)cycle highs of the price of $Btc
As #Btc
 becomes adopted over time, explosive growth on log scale is slowing
Shoot up hard, touched upper multiple. A correction before next leg up makes sense to me
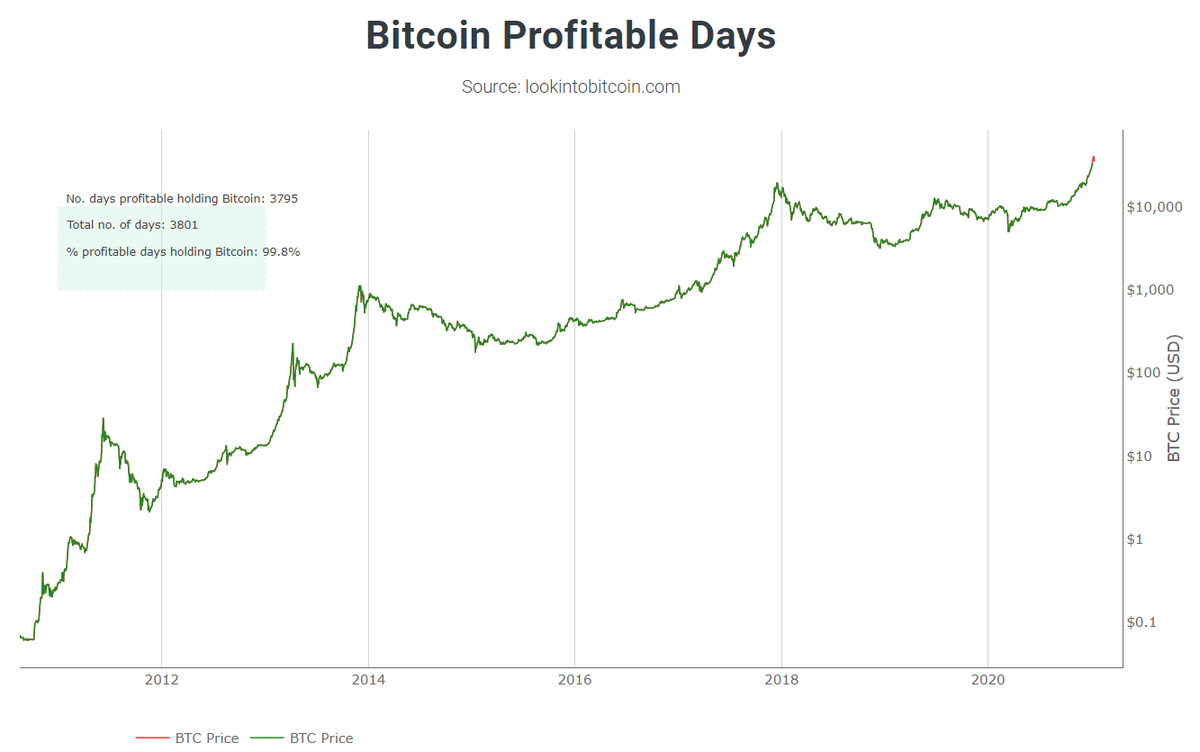
11/ Bitcoin profitable days
When was it profitable to buy $Btc, relative to today’s price?
% profitable days holding #Btc : 99.8%
Supply = limited
Demand: grows
Price: moves up, over time.
Simple shizzle
Tik-Tokers & rappers who bought the (temporary) top in disbelief/panic.
When was it profitable to buy $Btc, relative to today’s price?
% profitable days holding #Btc
 : 99.8%
 Supply = limited
Demand: grows
Price: moves up, over time.
Simple shizzle
Tik-Tokers & rappers who bought the (temporary) top in disbelief/panic.
12/ Reserve Risk
Confidence high? Price low? R/R to invest is attractive: green zone.
We’ve just left the green zone, again feels like mid ’17 to me.
Buy green, sell red. Simple shit.
Wanna know more? https://www.lookintobitcoin.com/charts/reserve-risk/
Confidence high? Price low? R/R to invest is attractive: green zone.
We’ve just left the green zone, again feels like mid ’17 to me.
Buy green, sell red. Simple shit.
Wanna know more? https://www.lookintobitcoin.com/charts/reserve-risk/
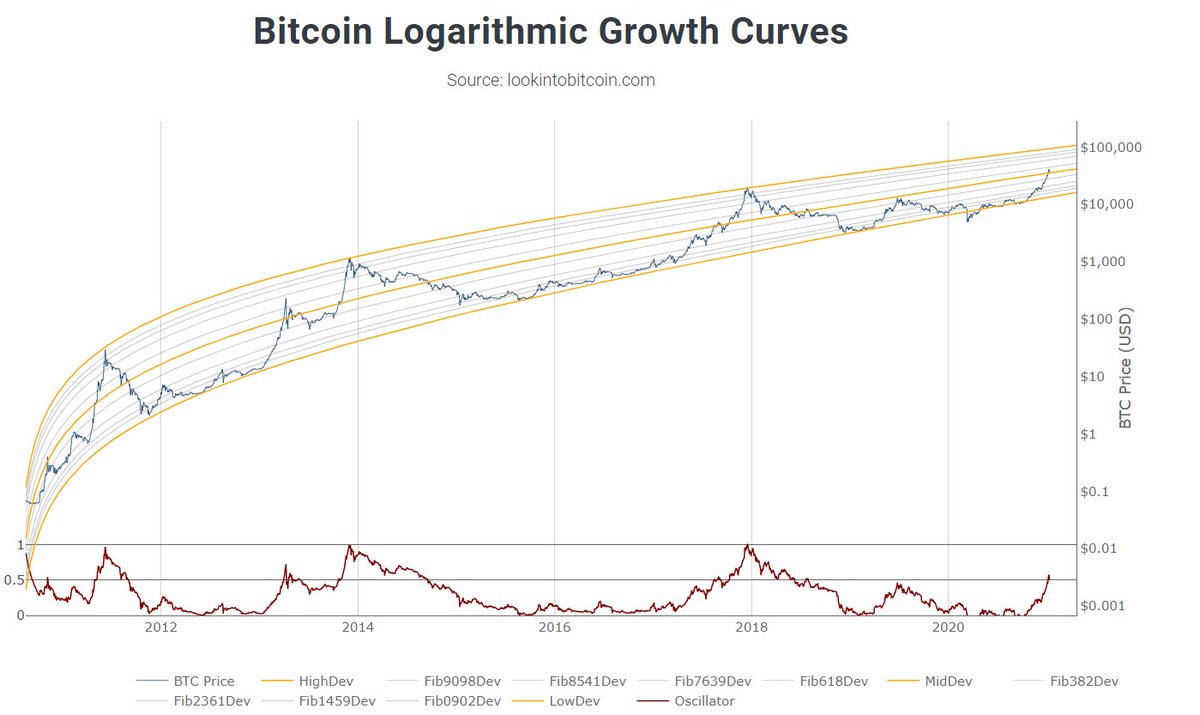
13/ Bitcoin logarithmic growth curves
% of price growth decreases, but bottoms and tops will be higher. Narrowing. No cycle top before $100K? Highly possible imho
About to flip the middle band? I’d say correction first, then flip. But market is so crazy we can blast on rn
% of price growth decreases, but bottoms and tops will be higher. Narrowing. No cycle top before $100K? Highly possible imho
About to flip the middle band? I’d say correction first, then flip. But market is so crazy we can blast on rn

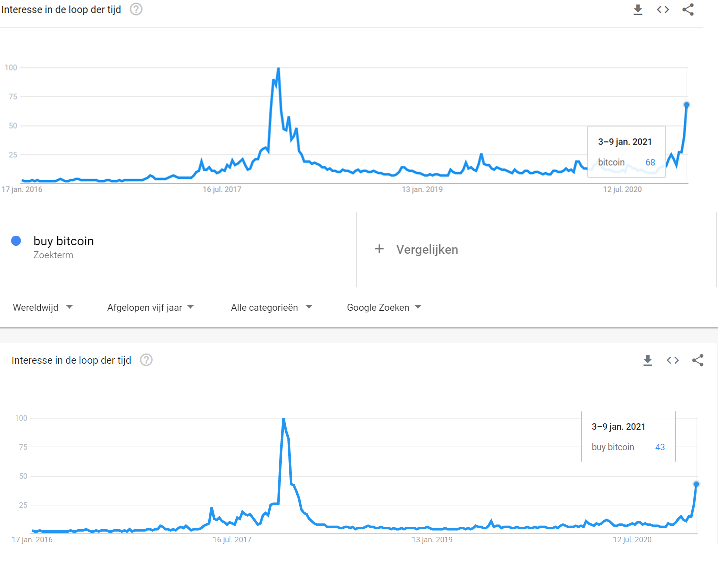
14/ Google trends
Finally we got pleb attention. Look at the media. After we crossed ath, it is suddenly everywhere again. I think we’ll exceed previous high a lot this year. Notice the difference:
Above: Bitcoin
Below: Buy bitcoin
They know, but not everybody is convinced to buy
Finally we got pleb attention. Look at the media. After we crossed ath, it is suddenly everywhere again. I think we’ll exceed previous high a lot this year. Notice the difference:
Above: Bitcoin
Below: Buy bitcoin
They know, but not everybody is convinced to buy
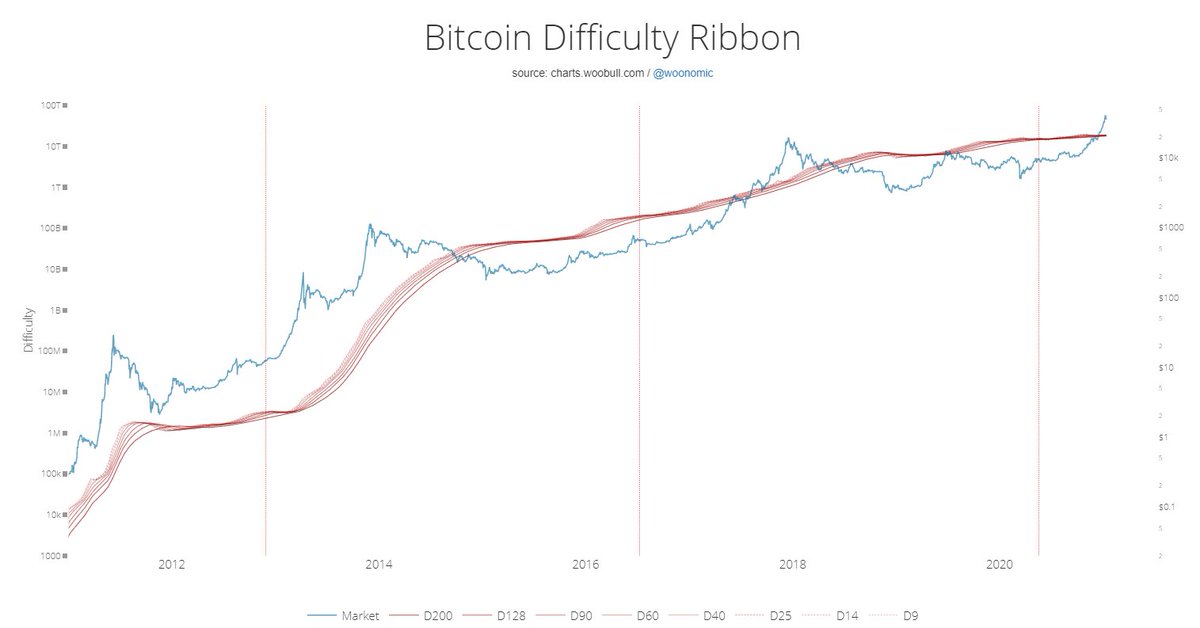
15/ Difficulty Ribbon
To view miner capitulation, signals times when buying is sensible
When network difficulty reduces rate of climb: weak miners leave, strong miners survive: less sell pressure.
Best time to buy is where the Ribbon compresses (I’m not saying buy here )
)
To view miner capitulation, signals times when buying is sensible
When network difficulty reduces rate of climb: weak miners leave, strong miners survive: less sell pressure.
Best time to buy is where the Ribbon compresses (I’m not saying buy here
 )
)
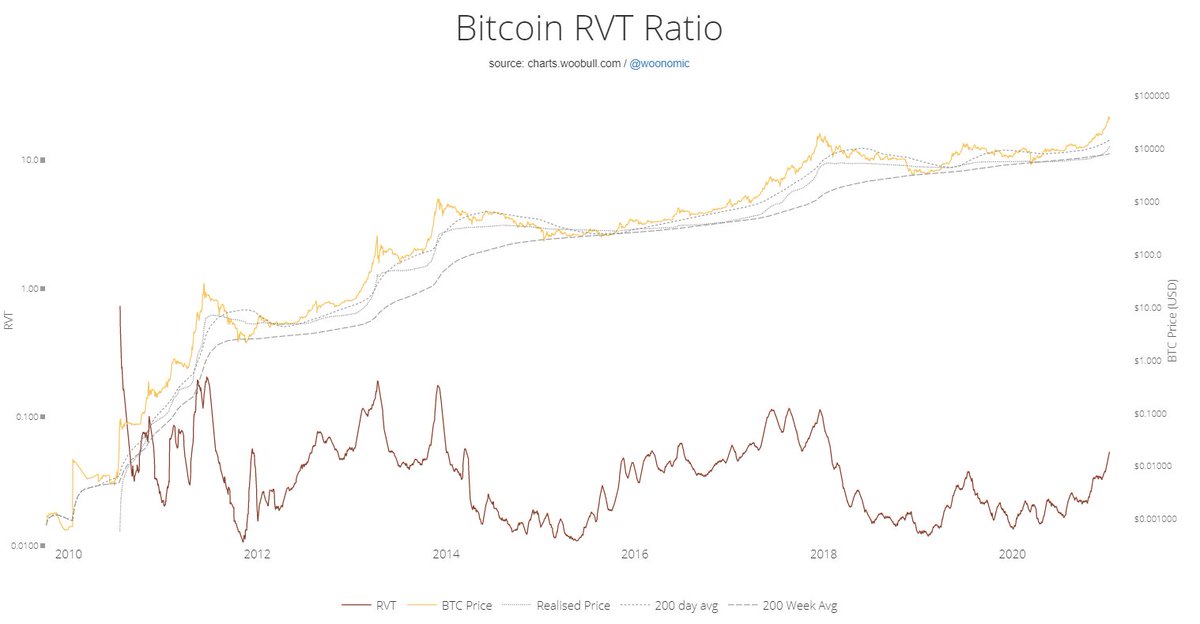
16/ (1/2) Bitcoin RVT Ratio (Realised Value to Transaction Ratio)
It compares transaction volume to the relevant valuation.
RTV Ratio uses Realised market cap. That is a Bitcoin value model representing average cost basis of the entire market, also discounting lost coins.
It compares transaction volume to the relevant valuation.
RTV Ratio uses Realised market cap. That is a Bitcoin value model representing average cost basis of the entire market, also discounting lost coins.
17/ (2/2) Bitcoin RVT Ratio
RVT high/increasing: Price overvalued
RVT low/decreasing: Price undervalued
RVT sideways: sustainable valuation, relative to transaction volume.
Now: increasing at a rapid pace. I think we’ll see it being volatile both ways the coming time.
RVT high/increasing: Price overvalued
RVT low/decreasing: Price undervalued
RVT sideways: sustainable valuation, relative to transaction volume.
Now: increasing at a rapid pace. I think we’ll see it being volatile both ways the coming time.
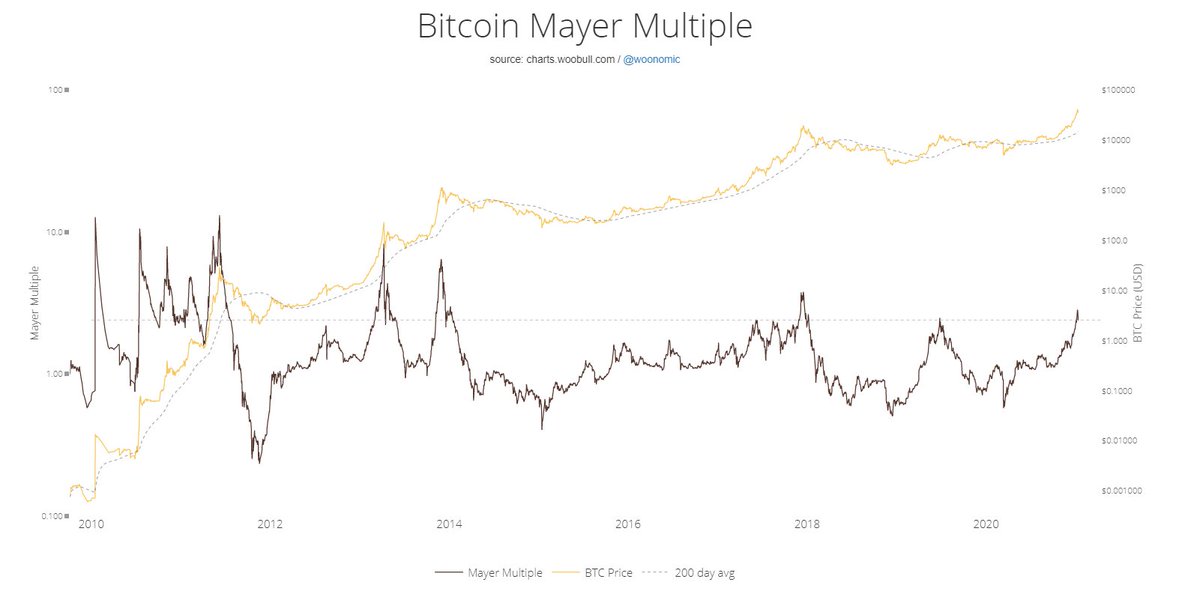
18/ Mayer multiple
A measurement to see if btc is under/overvalued, HTF, plotted against it’s 200 D ma.
The Bitcoin market as a whole becomes larger, thus less volatile, so the peaks on this indicator are becoming less high.
Now: Overvalued region, in for a correction imho.
A measurement to see if btc is under/overvalued, HTF, plotted against it’s 200 D ma.
The Bitcoin market as a whole becomes larger, thus less volatile, so the peaks on this indicator are becoming less high.
Now: Overvalued region, in for a correction imho.
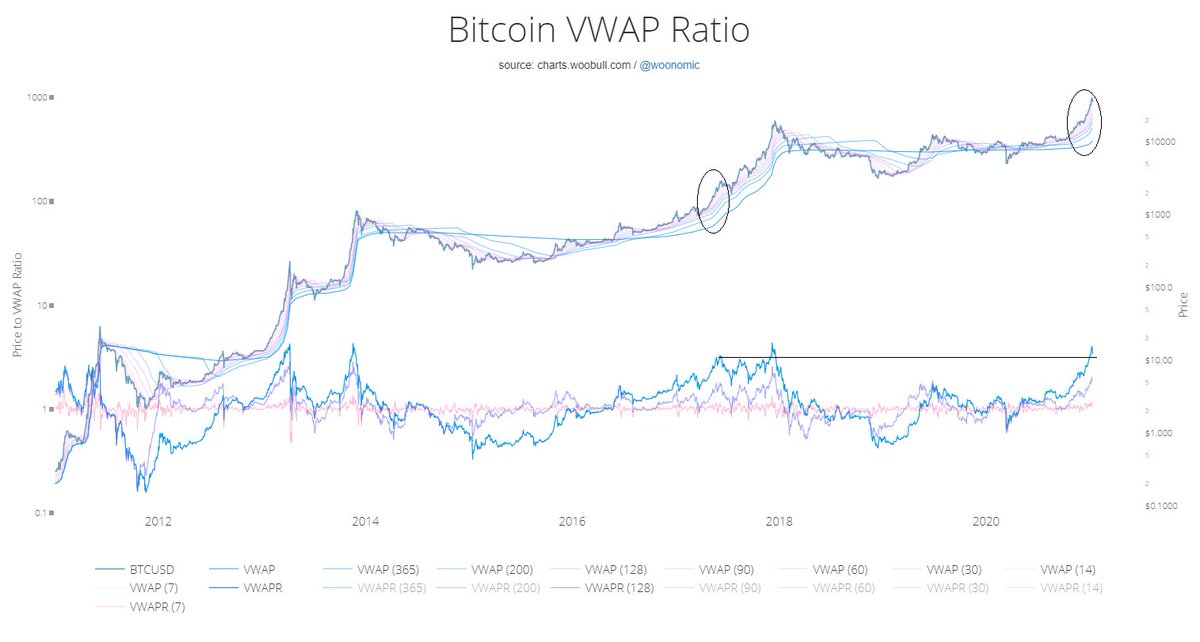
19/ Bitcoin Vwap
Vwap combines power of volume with price action. Usefull to confirm a trend or to time entry/exit points. To determine the average price market participants payed fort heir coins. It’s also a kind of a trend flow. Circled what I think is same action prev cycle.
Vwap combines power of volume with price action. Usefull to confirm a trend or to time entry/exit points. To determine the average price market participants payed fort heir coins. It’s also a kind of a trend flow. Circled what I think is same action prev cycle.
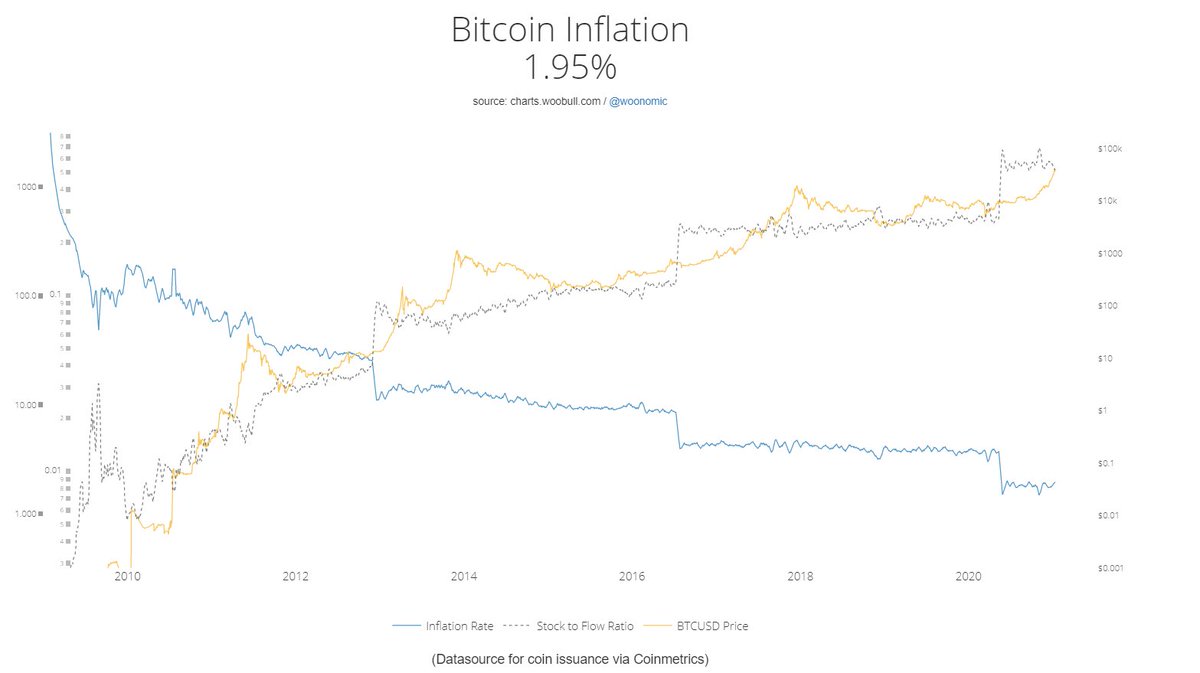
20/ Bitcoin inflation rate
I think this one speaks for itself if you know something about inflation
It will keep on decreasing after each halving.
I think this one speaks for itself if you know something about inflation
It will keep on decreasing after each halving.
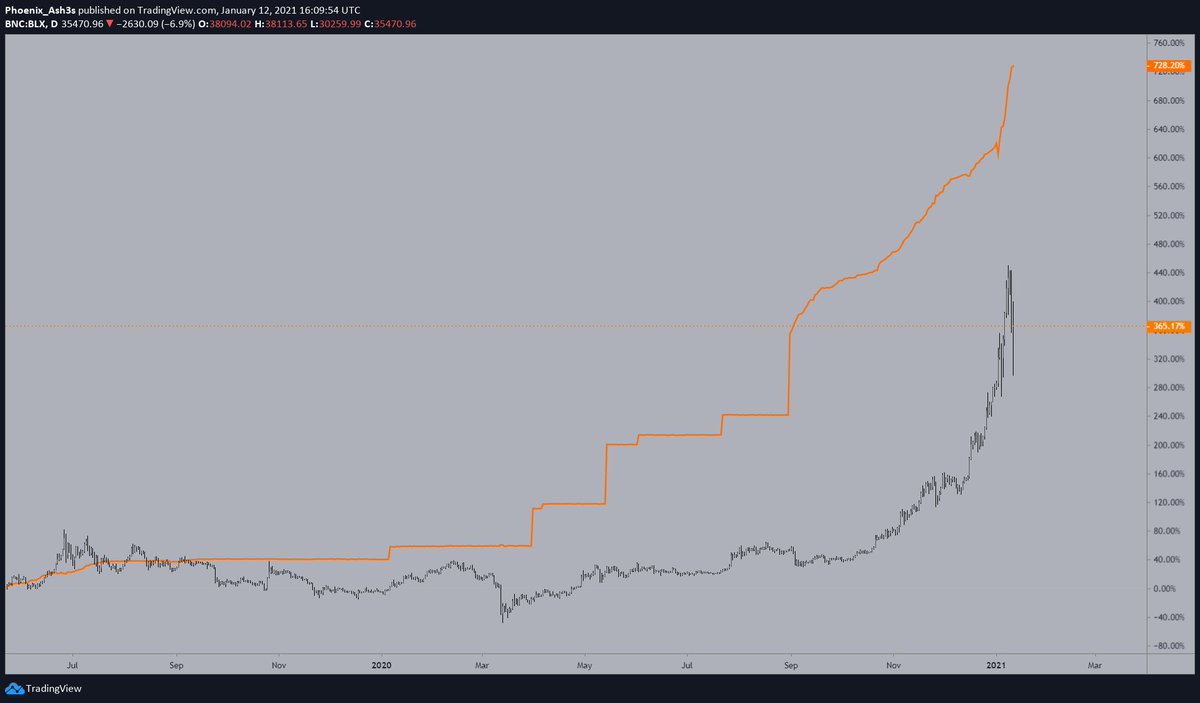
21/ Halvings
The fresh supply miners will recieve for mining a block get’s cut in half every ~4 years. We’ve recently witnessed a halving last may. Reward for miners cut in half means price has to be high enough for them to keep active . So are they? Yes, Read on…
The fresh supply miners will recieve for mining a block get’s cut in half every ~4 years. We’ve recently witnessed a halving last may. Reward for miners cut in half means price has to be high enough for them to keep active . So are they? Yes, Read on…
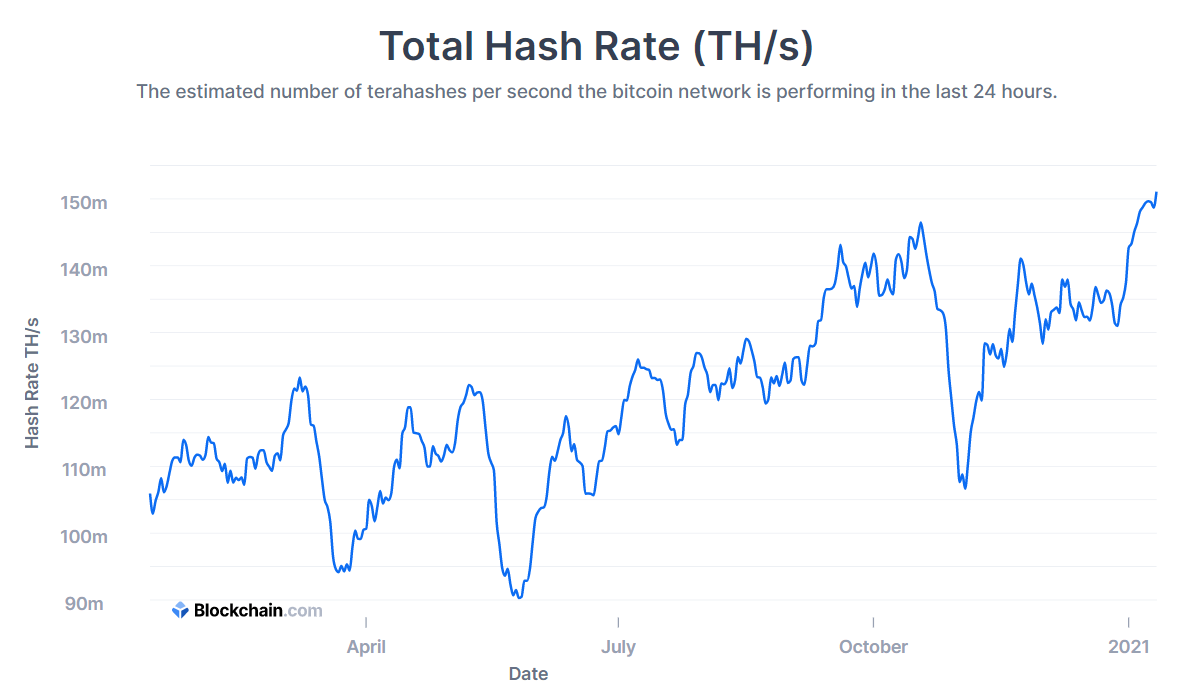
22/ Hash rate
Measuremet of the computing power of the Btc network.
The higher the hash rate, the more miners active, the more secure the network. Dips have been absorved fast. Bullish
At an ATH. I think you want to be buying dips/corrections folks!

Measuremet of the computing power of the Btc network.
The higher the hash rate, the more miners active, the more secure the network. Dips have been absorved fast. Bullish
At an ATH. I think you want to be buying dips/corrections folks!


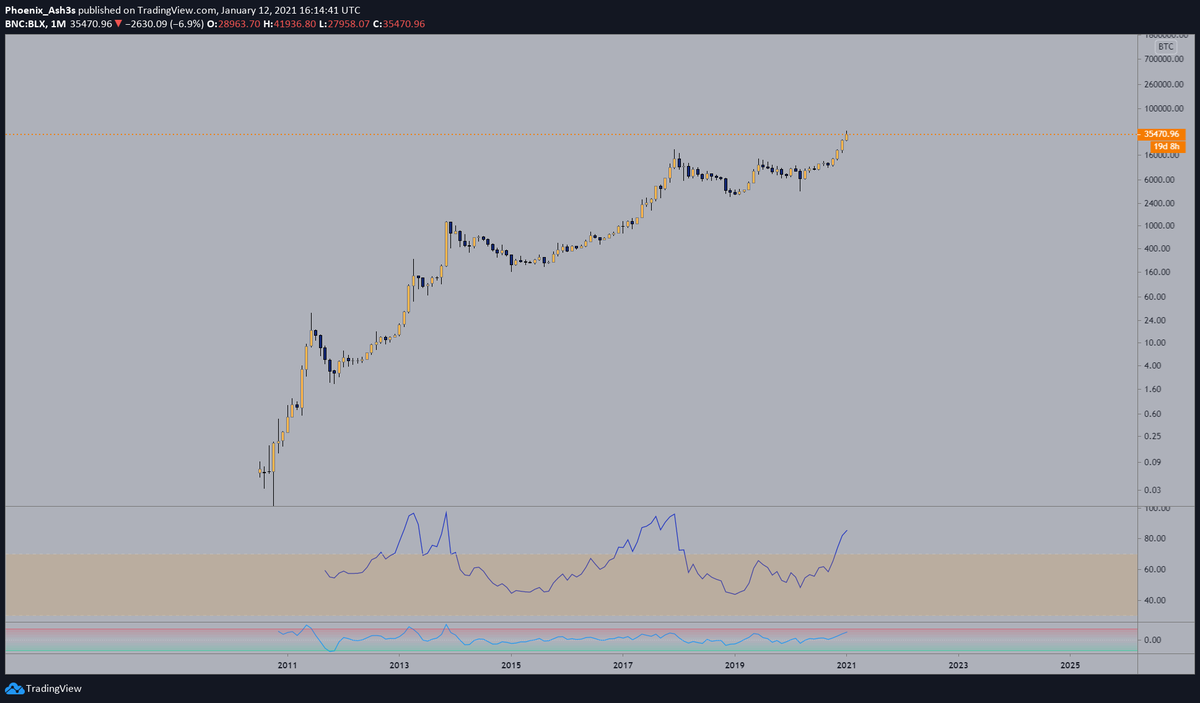
24/ Long term estimated view
Question yourself. Do you want to short an asset that looks like this or do you accumulate the dips?
Oh no! It’s overbought! Bitcoin stayed overbought on the M for a whole year previous cycles.
Betting against #Bitcoin is like the Harakiri
Question yourself. Do you want to short an asset that looks like this or do you accumulate the dips?
Oh no! It’s overbought! Bitcoin stayed overbought on the M for a whole year previous cycles.
Betting against #Bitcoin
 is like the Harakiri
25/ Abbreviations
MA= Moving Average
P/L= Profit/Loss
DCA= Dollar Cost Averaging
MC= Market Cap
TP= Take Profit
#CT= Crypto Twitter
Ath= All time high
HODL= Hold On for Dear Life
R/R= Risk/Reward Ratio
Imo= in my opinion
MA= Moving Average
P/L= Profit/Loss
DCA= Dollar Cost Averaging
MC= Market Cap
TP= Take Profit
#CT= Crypto Twitter
Ath= All time high
HODL= Hold On for Dear Life
R/R= Risk/Reward Ratio
Imo= in my opinion
26/ Resources
While making this thread, I used the following websites:
https://www.lookintobitcoin.com/
https://charts.woobull.com/
https://glassnode.com/
https://cryptoquant.com
While making this thread, I used the following websites:
https://www.lookintobitcoin.com/
https://charts.woobull.com/
https://glassnode.com/
https://cryptoquant.com
27/ (1/3) TLDR;
A lot of models show overextension in the short term, tho are still extremely bullish for the coming year
Price and model wise it looks a lot like mid 2017 to me. Tho I hope we’re not there already…
A lot of models show overextension in the short term, tho are still extremely bullish for the coming year
Price and model wise it looks a lot like mid 2017 to me. Tho I hope we’re not there already…
28/(2/3)
Don’t get yourself rekt changing your bias based on a 1h chart. Zoom out, every day/week. Keeps yourself calm
Fundamentals and the charts don’t lie. We may correct hard, but will go up again, over time.
A lot.
Don’t get yourself rekt changing your bias based on a 1h chart. Zoom out, every day/week. Keeps yourself calm
Fundamentals and the charts don’t lie. We may correct hard, but will go up again, over time.
A lot.
29 (3/3) I think/hope we will see a decent correction. That would be healthier. But it’s not what I hope, but what the market presents.
DM’s are open if you wanna ramble more.
Stick to your self made plan & set targets, let's make this your year!
 Phoenix out
DM’s are open if you wanna ramble more.
Stick to your self made plan & set targets, let's make this your year!
 Phoenix out

 Read on Twitter