This got me thinking. I instinctually was like, "This is definitely wrong..." and went to check it. And indeed, it's wrong. Graphs below! https://twitter.com/jmhorp/status/1348702526317727752
So we have to start by asking, "How do we calculate excess deaths?"
By "excess deaths" we mean "deaths above the value we expect in this period based on some plausible counterfactual."
By "excess deaths" we mean "deaths above the value we expect in this period based on some plausible counterfactual."
But.... what is the plausible counterfactual!?!?!
This turns out to be super important in a lot of cases. Deciding what the baseline would have been is kind of a big deal.
This turns out to be super important in a lot of cases. Deciding what the baseline would have been is kind of a big deal.
I have a very particular view of how you SHOULD define the baseline. It is at the root of a lot of my calculations. I think it's right. One reason I think it's right is it generates really intuitive and tight statistical relationships on the estimation end of things.
My method, however, is a bit controversial, because it involves a very irritating assumption a lot of people dislike. So let's dig in. You can decide if you like the assumption, then we'll look at results.
So, the most intuitive way to do excess deaths is just to divide deaths in period X by deaths in some prior period Y. Maybe, 2020 vs. 2019.
The problem with this is that how you define the period matters. You might have huge excess deaths in PART of 2020, but then low deaths...
The problem with this is that how you define the period matters. You might have huge excess deaths in PART of 2020, but then low deaths...
In a later part. If those low deaths are because deaths were "pulled forward," then you could show ZERO excess deaths even if you actually had a LARGE loss of "life years."
So for this reason, a lot of people define excess deaths only in gross terms: they drop out periods where they run negative, and only track above-baseline periods.
I'm sympathetic to this but ultimately don't adopt this method. Not because it's wrong, but because comparing across regions its often unclear if deaths are running below trend in a given period due to "early harvest" or due to something I want to measure.
So I adopt a "net excess" calculation.
That's not the controversial assumption. Hopefully you're fine with that assumption. In practice, this assumption *reduces* my estimate below what some other sources might produce.
That's not the controversial assumption. Hopefully you're fine with that assumption. In practice, this assumption *reduces* my estimate below what some other sources might produce.
This also means my measure is *not* sensitive to if we use days, weeks, months, or years as our baseline period, provided our baseline is parameterized consistently across the whole period in which we want to measure excess deaths. That's a nice outcome!
Now we have to decide how to calculate what our baseline value actually is.
Should we use last year?
The average of the last 3 years?
The average of the last 5?
A linear extrapolation of the last 25?
Should we use last year?
The average of the last 3 years?
The average of the last 5?
A linear extrapolation of the last 25?
Should we build a complete mortality cohort model and forecast trends for each age group and cohort?
This exercise gets increasingly complex, ambiguous, and gimmicky.
This exercise gets increasingly complex, ambiguous, and gimmicky.
My view relates to an extremely important fact:
We mostly care about excess deaths in order to identify the effects of *events*. Events occur at discrete times, usually causing relatively *sudden* increases in deaths.
We mostly care about excess deaths in order to identify the effects of *events*. Events occur at discrete times, usually causing relatively *sudden* increases in deaths.
As such, we can pretty easily identify when an excess death event begins just from visual inspection, *even if it begins when net excess up to that point is running in the negatives*.
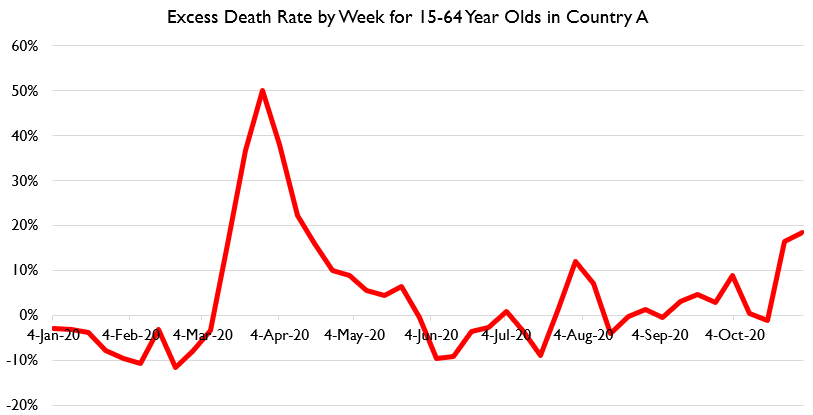
So for example, suppose we see the graph below. In this country, deaths for 15-64s did not rise above above their 2019-comparable-week levels until the week ending on the 14th of March. But we can see they began to take off from their trough in the week ending Feb 29th.
More broadly, we can see that excess deaths in this country for this age group were negative *throughout* early 2019.
My argument, my big assumption, is this:
The best counterfactual for the "excess death rate" for 2019.... is the cumulative "excess death rate" for January-February 2019.
The best counterfactual for the "excess death rate" for 2019.... is the cumulative "excess death rate" for January-February 2019.
Sorry, I mean 2020 there: the best baseline excess death rate for 2020 is the excess death rate for Jan-Feb 2020.
This may sound weird or overly simplistic, but it actually makes a lot of sense.
Any change in the population structure, age cohorts, or underlying epidemiological factors like the flu season *would show up* in the Jan-Feb 2020 vs. Jan-Feb 2019 ratio.
Any change in the population structure, age cohorts, or underlying epidemiological factors like the flu season *would show up* in the Jan-Feb 2020 vs. Jan-Feb 2019 ratio.
While a low ratio could indicate a very weak flu season, a weak winter flu season is not usually predictive of a bad summer death season; it often just means the next winter flu season will be bad. Those deaths pulled forward truly are excess deaths!
This method also helps us capture the issue of countries having large death-mountains piling up underwater. Instead of just seeing the smoking volcano poking above the excess death threshold at the top, we see the whole mountain.
If you dislike the 2019 baseline you could do 2017-2019 average if you prefer, but it's not going to change the calculation by much, because we've already double-differenced out most of the information you're trying to capture.
Basically, my assumption is that if COVID had not occurred, the excess death rates we observed in the months immediately prior to COVID would more-or-less have continued until September 2020.
I have stopped the data at September because 1) that's the last period for which all countries in the http://mortality.org database have data, 2) that's before the next flu season which could be impacted by prior flu seasons
So, if we compare "total deaths March-September 2020 / same period 2019" minus "total deaths Jan-Feb 2020 / same period 2019" that should tell us "how much higher were deaths in March-September 2020 vs. the most plausible counterfactual death rate."
Here's what we get for excess death rates for 15-64 year olds.
As you can see, Sweden does have excess deaths for 15-64s. Considerably MORE than e.g. Germany. France also clearly has excess 15-64 deaths.
As you can see, Sweden does have excess deaths for 15-64s. Considerably MORE than e.g. Germany. France also clearly has excess 15-64 deaths.
There is definitely still variation. And since we see considerably variation in deaths among 15-64 year olds, who are less likely to die of COVID, the question that interested @jmhorp remains: what explains it?
Well, let's venture a guess...
Well, let's venture a guess...
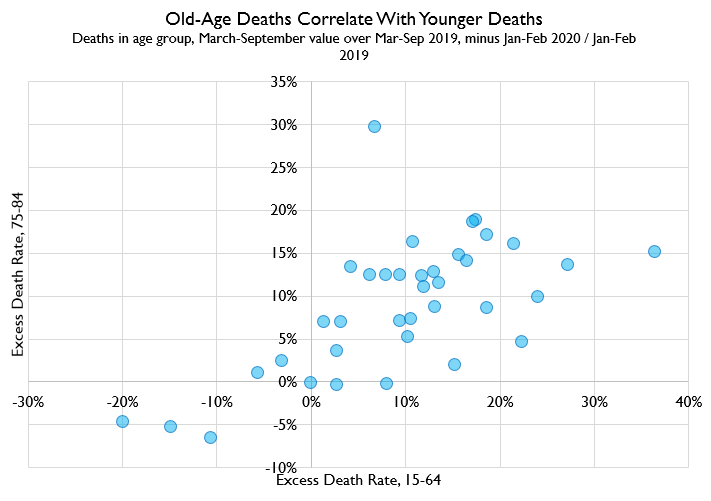
Here's the correlation between that excess death measure for 15-64 year olds, and the exact same measure for 75-84 year olds.
Well, I'll be. It looks like they're correlated.
Well, I'll be. It looks like they're correlated.
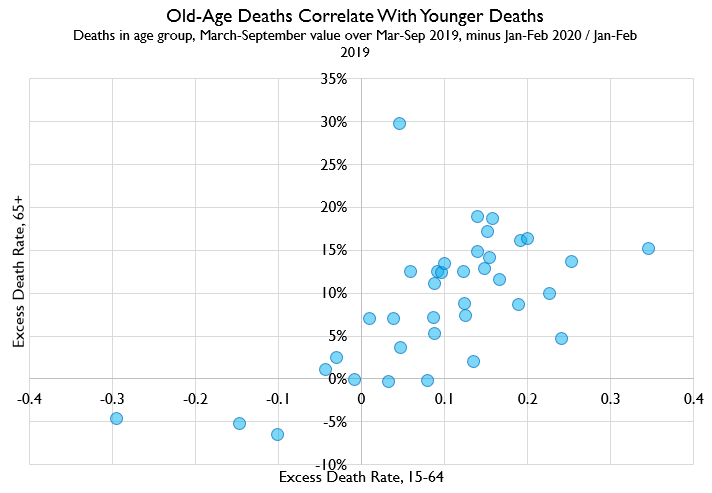
And here it is, comparing 15-64 to all 65+. It's even tighter, except that weird outlier up top, which is Northern Ireland, and I dunno what's going on there.
So as far as I'm concerned, this is case closed.
But maybe you're skeptical. Maybe you're saying to yourself, "This Lyman guy; he's full of crap. I'm sure he's burying the truth in his eccentric baseline adjustment! He made such a stink of it, I'm sure that's the issue!"
But maybe you're skeptical. Maybe you're saying to yourself, "This Lyman guy; he's full of crap. I'm sure he's burying the truth in his eccentric baseline adjustment! He made such a stink of it, I'm sure that's the issue!"
hhahaha neener neener I got you you don't even need my correction for the trend the relationship still holds I was just being scrupulous and complete
young deaths are tightly correlated with old deaths
young deaths are tightly correlated with old deaths
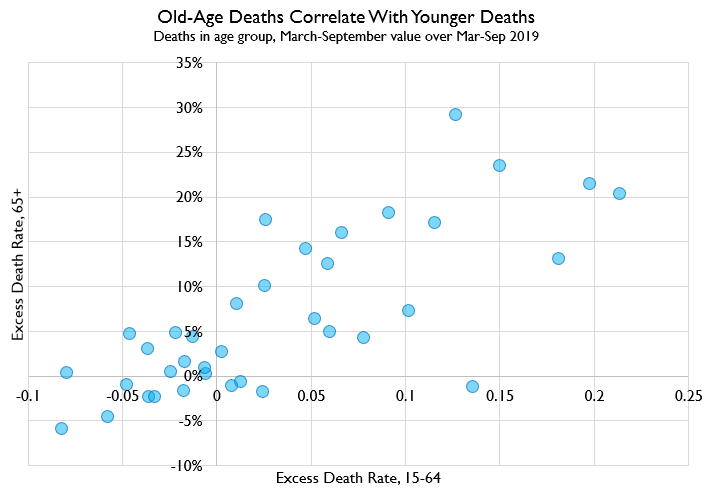
but maybe you're like, "oh that tricksy lyman fellow, always up to tricks: the real problem is he's comparing to 2019, when he should compare to the 2015-2019 average!"
that does look a little bit noisy though i wonder what happens if we do the differencing-out-january-and-february thing i suggested
oh hey look suddenly they're very tightly correlated again
oh hey look suddenly they're very tightly correlated again
So anyways.
The conclusion of this thread is simple.
Where COVID spreads, people die. Changes in death rates are very highly correlated across age groups. Where olds die, youngs die.
The conclusion of this thread is simple.
Where COVID spreads, people die. Changes in death rates are very highly correlated across age groups. Where olds die, youngs die.
The absolute scale of increase varies. But the variance is roughly proportional to baseline death rates. Yes, COVID kills old people at like 5-50x the rate as young people.
But *everything* kills old people at 5-50x the rate as young people!
But *everything* kills old people at 5-50x the rate as young people!
For almost every age group, getting COVID approximately *doubles* the risk that you die in a given year. That is, the underlying IFR for COVID is roughly similar for most age groups to the background risk of dying of ~everything else~.
It so happens that younger people are more resilient to almost every natural cause of death.
But nonetheless, COVID elevates the risk of a young person dying, and deaths of prime-age people have risen dramatically in countries with uncontrolled COVID outbreaks.
But nonetheless, COVID elevates the risk of a young person dying, and deaths of prime-age people have risen dramatically in countries with uncontrolled COVID outbreaks.

 Read on Twitter


