1/ Since weirdly none of my price charts are working today  , it’s a great time to have a look at Bitcoin and Ethereum’s fundamentals.
Are they seeing increased adoption? How is network security? Are they enabling more economic activity?
 , it’s a great time to have a look at Bitcoin and Ethereum’s fundamentals.
 Are they seeing increased adoption? How is network security? Are they enabling more economic activity?
2/ I'll start with holding patterns since BTC aims first to be a store of value.
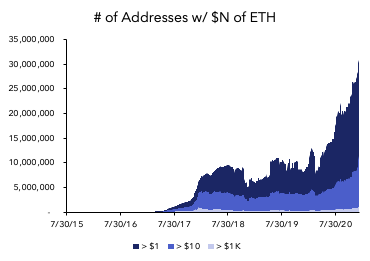
Below are the number of addresses on each chain with N USD worth of coin:
Bitcoin
Below are the number of addresses on each chain with N USD worth of coin:
Bitcoin
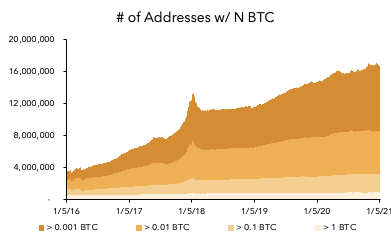
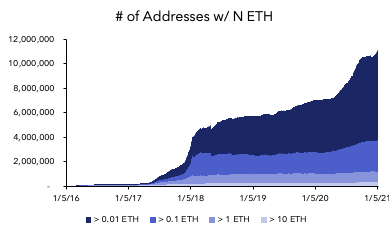
4/ Since this metric is heavily impacted by price, it's helpful to also look at the number of address with N native units of coin:
Bitcoin
Bitcoin
6/ Looking pretty good for growth rates in the HODLer segment! Nice and steady growth for BTC through the bear market. Retail is starting to pop in but for most of 2020 this was institutionally driven - less additional holders, but much larger position sizes.
7/ Different story with ETH - notice the rise in the back half of 2020, much of which came before ETH's more recent price run up. This is at least partially driven by the growth of DeFi over the summer.
8/ Note that this doesn't capture accounts with Coinbase, PayPal, Binance and other centralized onramps, which aggregate user funds.
To get a sense for crypto buying activity on PayPal, see @santiagoroel recent tweet: https://twitter.com/santiagoroel/status/1347029118630514692?s=20
To get a sense for crypto buying activity on PayPal, see @santiagoroel recent tweet: https://twitter.com/santiagoroel/status/1347029118630514692?s=20
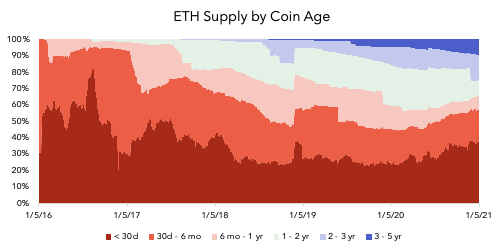
9/ Now let’s look at the distribution by coin age instead of by address value. This breaks up the coin supply by time since they were last active. Coins in the higher age buckets are an indicator of long-term HODLing (as well as lost coins).
BTC in healthy territory
BTC in healthy territory
10/ ETH is naturally further behind on its trajectory towards being a long-term store of value (should be expected)
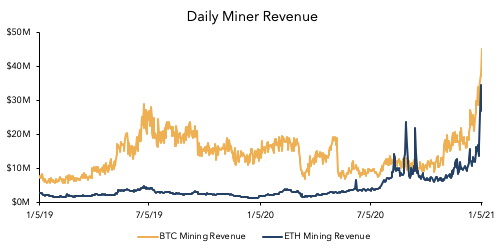
11/ Next, one of my favorite metrics, each network's daily security budget -- measured by miner revenue (fees + block rewards).
Miner revenue is indicative of the cost of 51% attacking the network. This is the aggregate daily opportunity cost for miners who cheat the rules.
Miner revenue is indicative of the cost of 51% attacking the network. This is the aggregate daily opportunity cost for miners who cheat the rules.
12/ Miner revenue is at all-time-highs for both. Note that this doesn't take into account the long exposure that miners have to each asset, which further disincentivizes bad behavior.
This time around, the networks are much more expensive to corrupt.
This time around, the networks are much more expensive to corrupt.
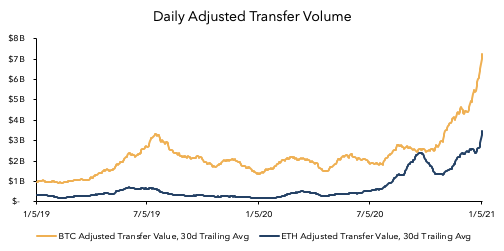
13/ Turning to the economic activity supported by each network, starting with adjusted daily USD transfer volumes:
14/ BTC is moving $7B per day on-chain; ETH almost $4B. This doesn't include tokens or stablecoins.. and stablecoins alone accounted for over $15B of on-chain transfer volume in the last 24 hours.
Ethereum is moving over $20B of assets per day, most of which is digital USD!
Ethereum is moving over $20B of assets per day, most of which is digital USD!
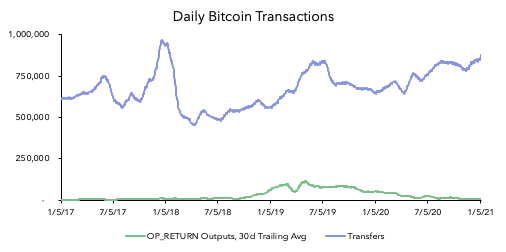
15/ Pundits will argue that transfer volume is too heavily distorted by token prices. Let's look at raw transaction counts.
BTC
BTC
16/ ETH
Look at the number of completed contract calls on Ethereum. If you are wondering what indicates product market fit for a smart contract platform, it's this.
Look at the number of completed contract calls on Ethereum. If you are wondering what indicates product market fit for a smart contract platform, it's this.
17/ In sum, prices go up and down but what really matters is the secular growth of a new technology. The fundamentals tell the more interesting story: public blockchain networks saw organic growth through the bear market, and that growth is now being compounded by the bull market
18/ When I look at these data, I've never been more optimistic on the prospects for both Bitcoin and Ethereum. The activity on both chains has materially de-risked them when compared to the state of the world in 2017. For real signal, look on-chain.
19/ H/t to @coinmetrics for most of this data.
This is just the tip of the ice berg - some great other sources:
* @spencernoon 's newsletter @OurNetwork__ (esp for DeFi)
* @yassineARK 's recent BTC deep dive https://twitter.com/yassineARK/status/1348714975905402880?s=20
* @nansen_ai for ETH address data
This is just the tip of the ice berg - some great other sources:
* @spencernoon 's newsletter @OurNetwork__ (esp for DeFi)
* @yassineARK 's recent BTC deep dive https://twitter.com/yassineARK/status/1348714975905402880?s=20
* @nansen_ai for ETH address data

 Read on Twitter
