A short thread on Public Health England (PHE)'s weekly all-cause Mortality Surveillance report and excess mortality.
PHE publish a weekly report looking at mortality in England and the devolved administrations. The latest report covers the last week of 2020 ("week 53") and notes that "in England, no statistically significant excess mortality by week of death ... was seen overall" 1/6
This point has been noted by various commentators recently. But PHE also make it clear that "the recent weeks' data are estimates with large registration delay corrections and therefore should be interpreted with caution". 2/6
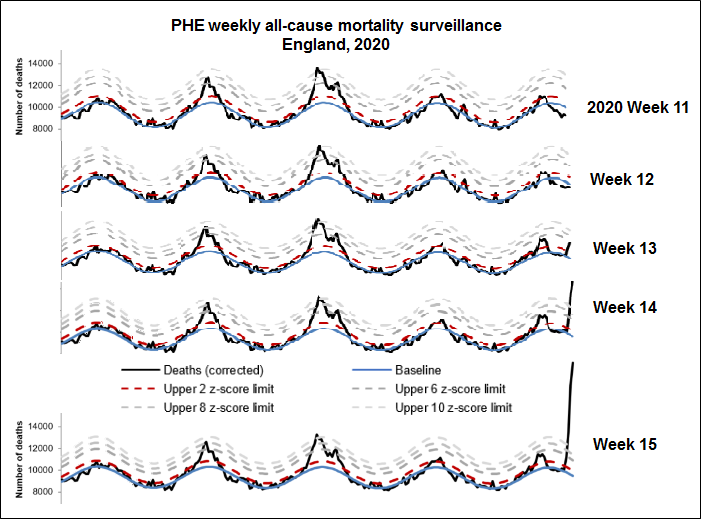
To indicate the extent to which the last weeks' data can change, I took charts from PHE's reports corresponding to the first wave (weeks 11 to 15 of 2020) and put them together for ease of comparison. 3/6
Focussing on the right hand side of the charts, and in particular weeks 12 to 13, it's clear that the number of deaths from several prior weeks have been adjusted upwards, from well below the blue line to on or above it, and from on the red line to well above it. 4/6
This means in particular that a week where no significant excess is seen in the week of the report can turn into a week with excess once subsequent reports are issued. 5/6
This is not to downplay how helpful it is that PHE produce such timely data - but I would strongly endorse and reiterate their words of warning about drawing particular conclusions from the latest weeks. 6/6

 Read on Twitter


