Here's a detailed thread explaining how the weekly ONS data should be interpreted when monitoring all cause mortality and excess deaths. It seems very common for people to misinterpret the data relating to excess deaths so I will do my best to clarify in a series of tweets. 1/10
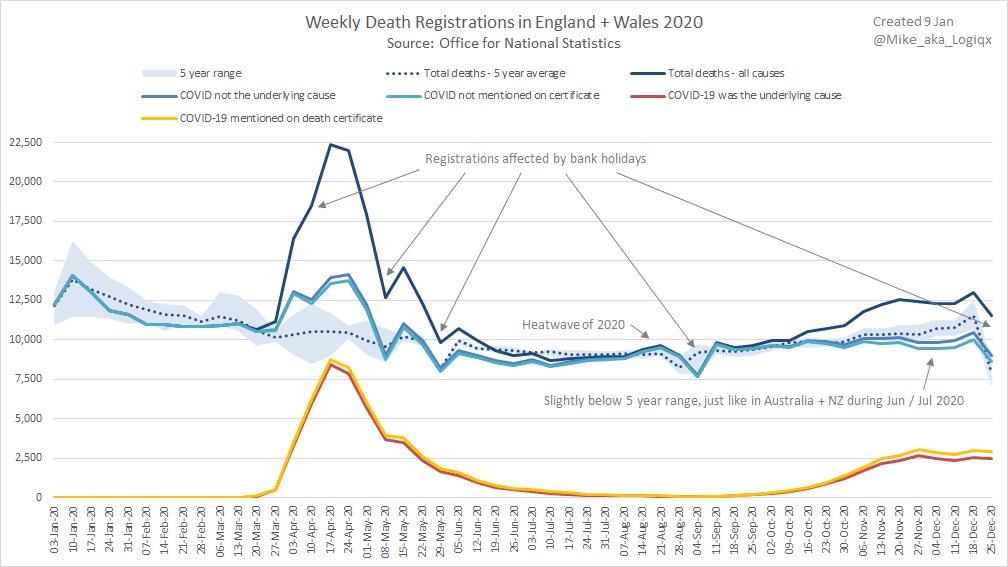
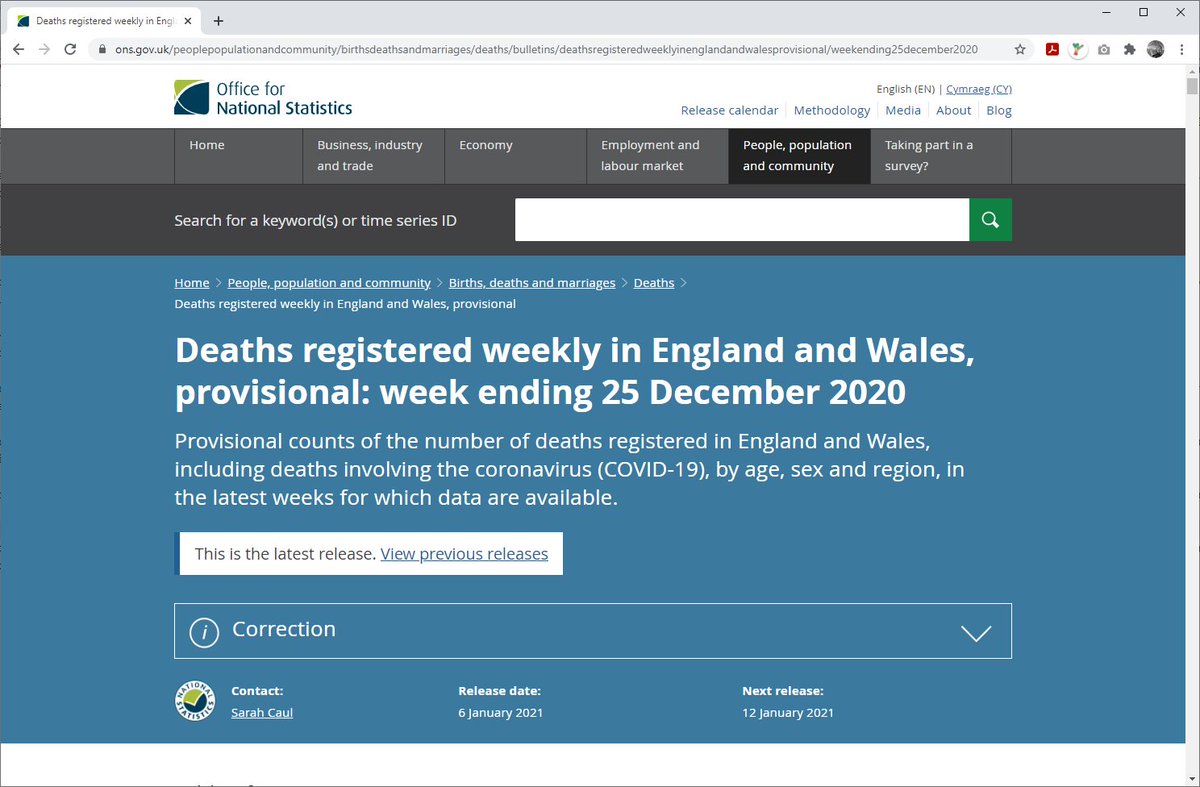
The ONS releases weekly death figures every Tue for registrations up to the Friday 11 days prior. On top of that it takes about 4 days to register a death so it is really deaths up to ~15 days prior. Bank holiday have a big impact on registrations, causing dips and spikes. 2/10
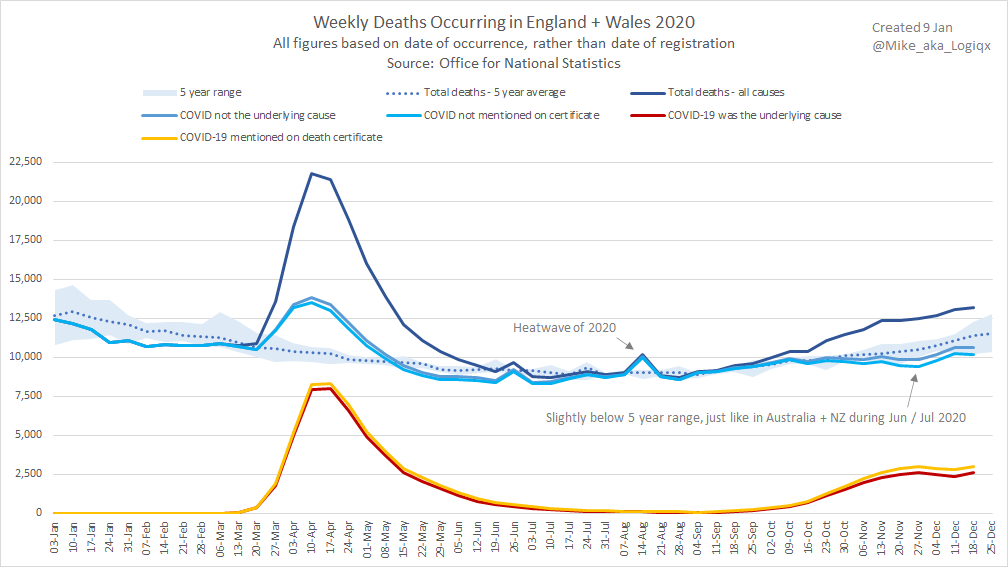
A clearer view is based on the date of registration. I'll link to an explanation of my modelling at the bottom of the thread but two things you should observe. 1) First wave had a lot of non-COVID excess deaths. 2) Second wave is significantly higher than the 5 year range. 3/10
It was also apparent that non-COVID deaths during Nov + Dec were slightly lower than the 5 year range. Check the previous image to see that this was far less significant than the excess. Countries who locked down and had few COVID deaths saw similar - e.g. Australia and NZ. 4/10
Now to PHE daily excess mortality in the weekly flu + COVID report. This is created from daily registrations, adjusted for the usual delays. The most recent data is incomplete because of reporting lags. Daily data is noisy and averaging 3SD from baseline is highly unusual. 5/10
Sticking with PHE data you must be cautious when comparing against COVID deaths. 1) A third of the height of the first wave was non-COVID excess. 2) The baseline of the second wave is *not* the same as the 5y average. 3) You're only seeing complete figures prior to mid-Dec. 6/10
The recent surge in hospitalisations started in Dec and deaths started to rise mid-Dec. The numbers currently visible in the ONS and PHE data are prior to the start of the surge and not apparent yet. Over the next 2-3 weeks the surge will be very clear in ONS + PHE data. 7/10
Figures that we see reported on a daily basis are deaths within 28 days of +ve test. ONS figures are based on death certificates but the two numbers match very closely. Doctors are required by *law* to complete certificates “to the best of their knowledge and belief”. 8/10
If you are using the ONS + PHE data to assess excess deaths that are happening *now* you are using the wrong data because of lags. The impact of this surge will only become apparent in future data from the ONS + PHE. If anyone has told you to study it now they are wrong! 9/10
If you are interested in the details of how I modelled the first wave they can be found in this document. I used my model for the first wave and the weekly ONS model for deaths following the first wave and the second wave. https://logiqx.github.io/ons-stats/data_prep 10/10
Here is a great thread detailing how recent data in the PHE report are estimates and should be interpreted with caution. It is not unusual for estimates be revised upwards, especially if something changes dramatically over a few short weeks. https://twitter.com/longevitymatt/status/1347967538601340930?s=20

 Read on Twitter


