GLOBAL ENERGY CONSUMPTION - A PRIMER
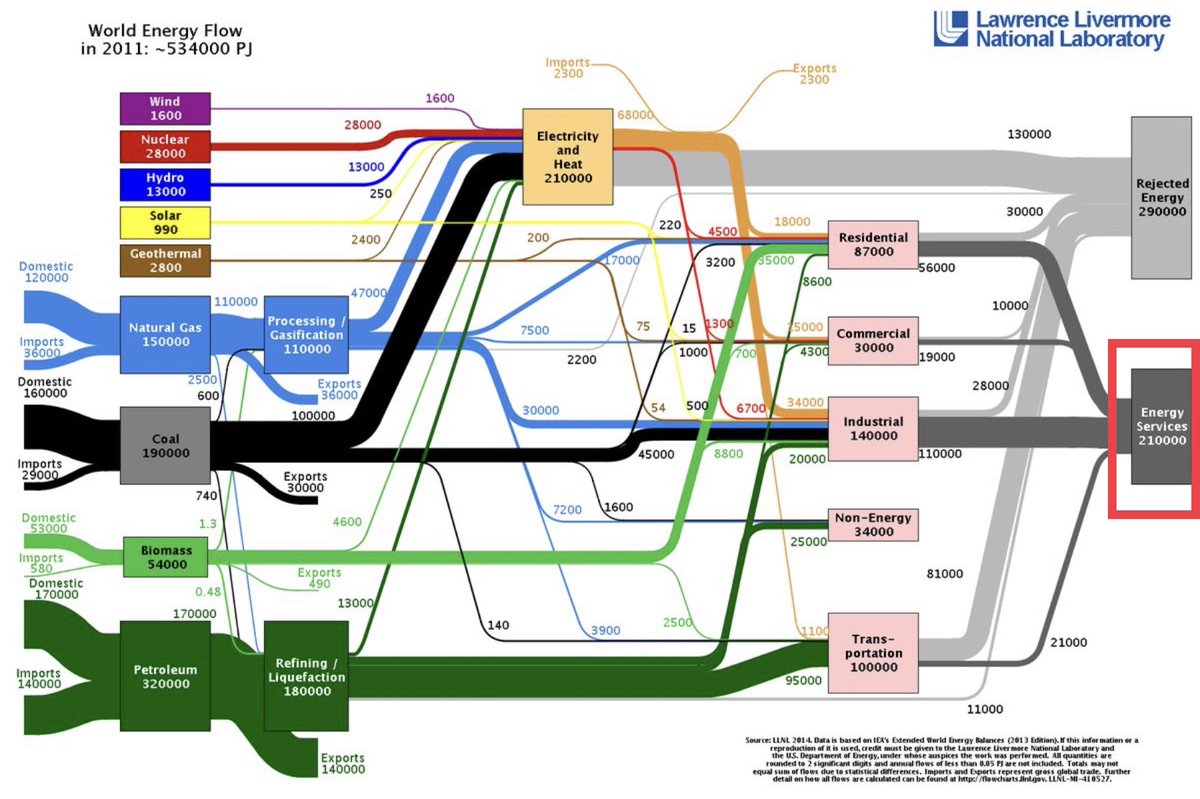
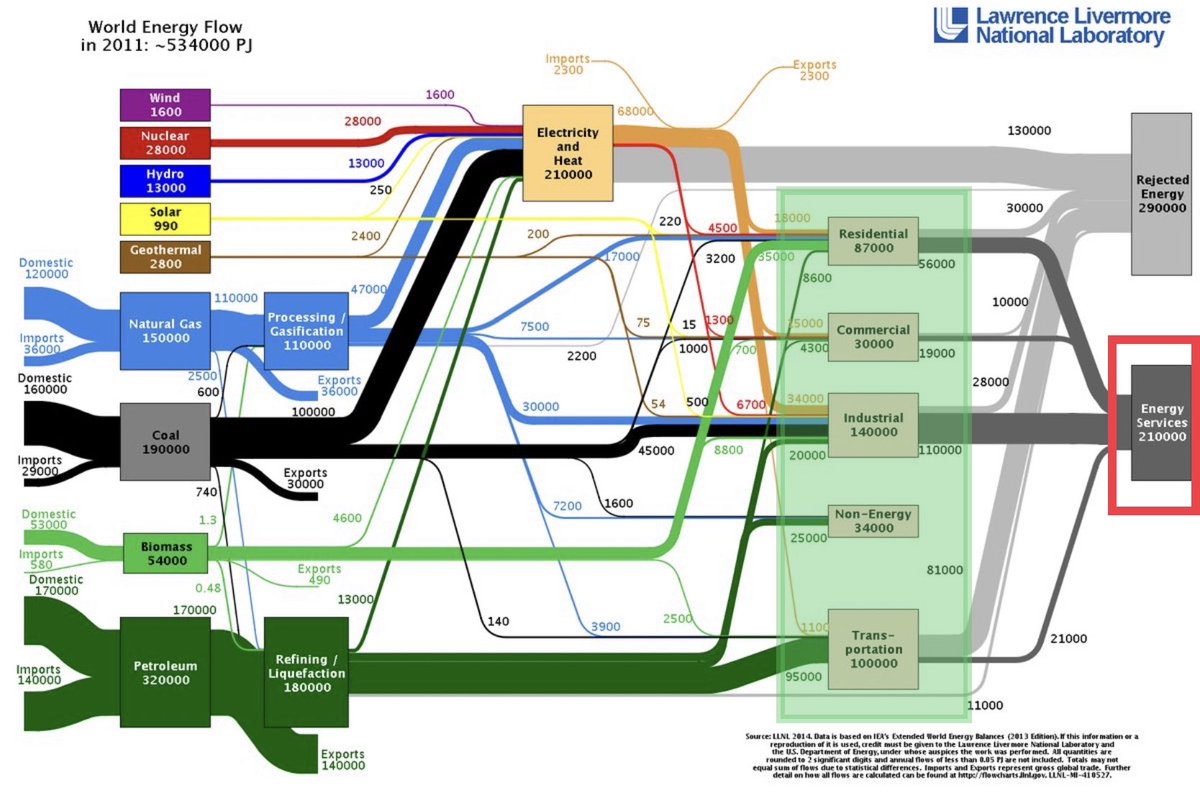
We have hopefully all seen this wonderful diagram from LLNL showing the Flow Diagram of the world’s Energy Consumption in a very useful form full of diagnostic power
So how did we get to here ?
And where are we going from here ?
We have hopefully all seen this wonderful diagram from LLNL showing the Flow Diagram of the world’s Energy Consumption in a very useful form full of diagnostic power
So how did we get to here ?
And where are we going from here ?
1. The recent history of Global Energy Consumption
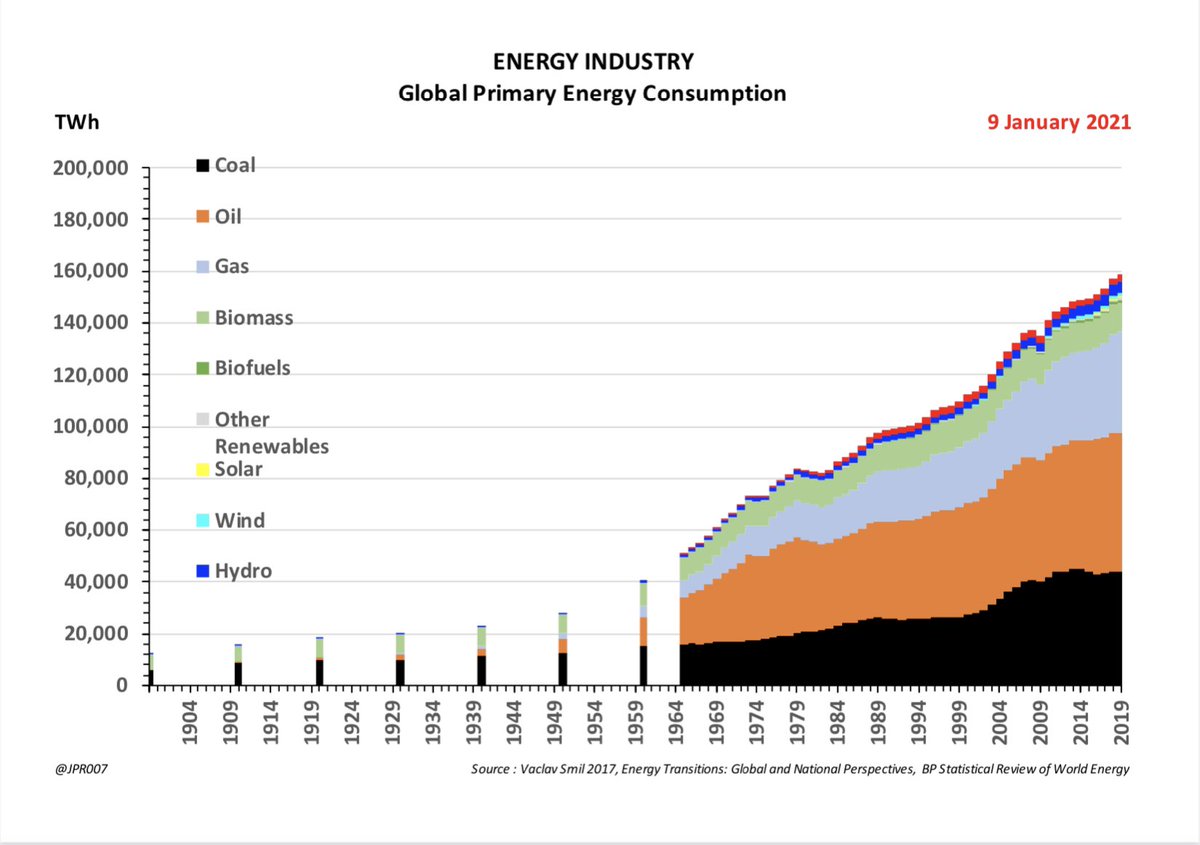
Back in the 1800s the primary use of energy was to generate heat by cutting down trees and vegetation and burning them as fuel - referred to here as “Traditional Biomass”
- this was a defining feature of our World 2.0
Back in the 1800s the primary use of energy was to generate heat by cutting down trees and vegetation and burning them as fuel - referred to here as “Traditional Biomass”
- this was a defining feature of our World 2.0
2. And then with the advent of the Industrial Revolution fossil fuels like Coal, Oil and Gas became increasingly important
- and they started to define many of the characteristics of our World 3.0
- and they started to define many of the characteristics of our World 3.0
3. Wood-burning Biomass has remained as a significant source of Energy even though its proportion has declined
4. Coal reached as high as 50% of our Energy supply and has continued to grow in absolute terms even though its proportion has shrunk to around 25%
4. Coal reached as high as 50% of our Energy supply and has continued to grow in absolute terms even though its proportion has shrunk to around 25%
5. Oil took over 40% of the Energy market until the Oil Shock of 1973 started changing our attitudes about the efficiency of its consumption
6. And Gas has been steadily growing its share of the market
6. And Gas has been steadily growing its share of the market
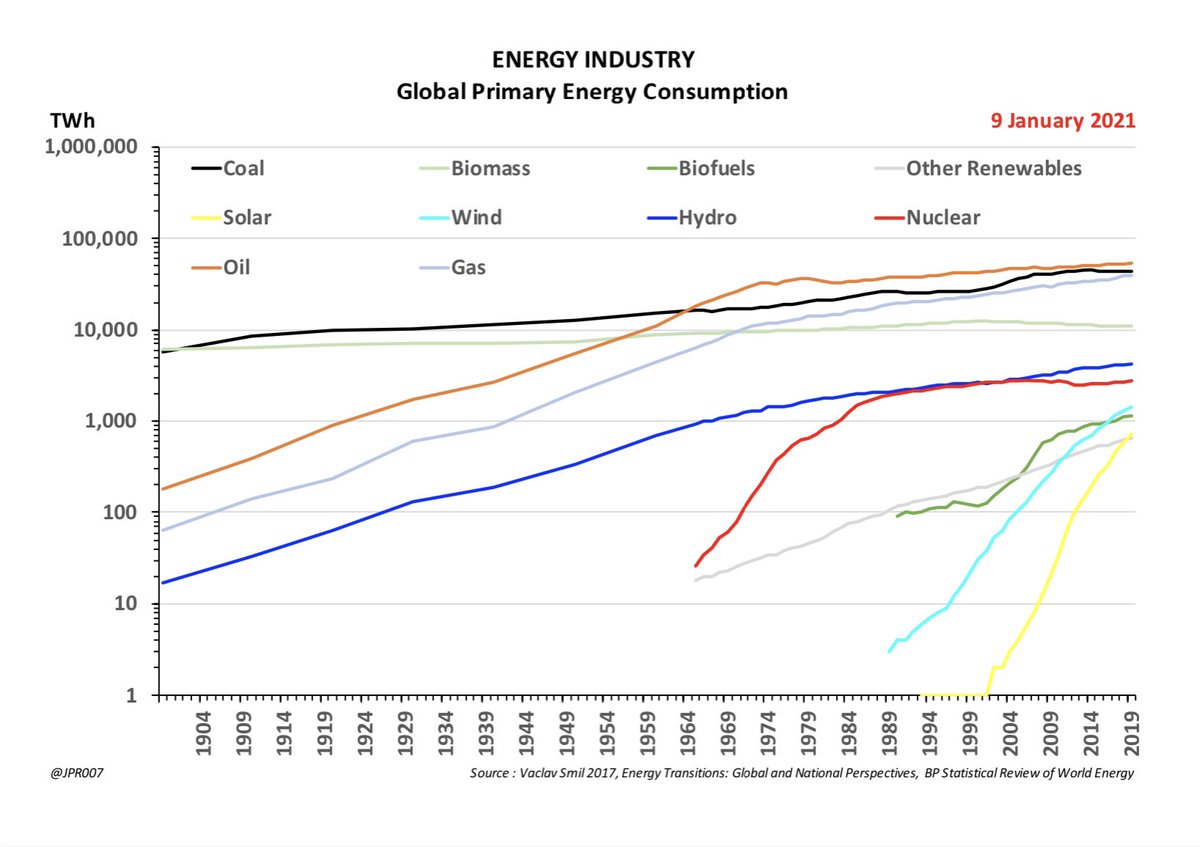
7. Hydro has long been a part of our Energy sources
8. And technology has more recently enabled Wind and Solar to have growth potential as Energy sources, but their scale remains very small
8. And technology has more recently enabled Wind and Solar to have growth potential as Energy sources, but their scale remains very small
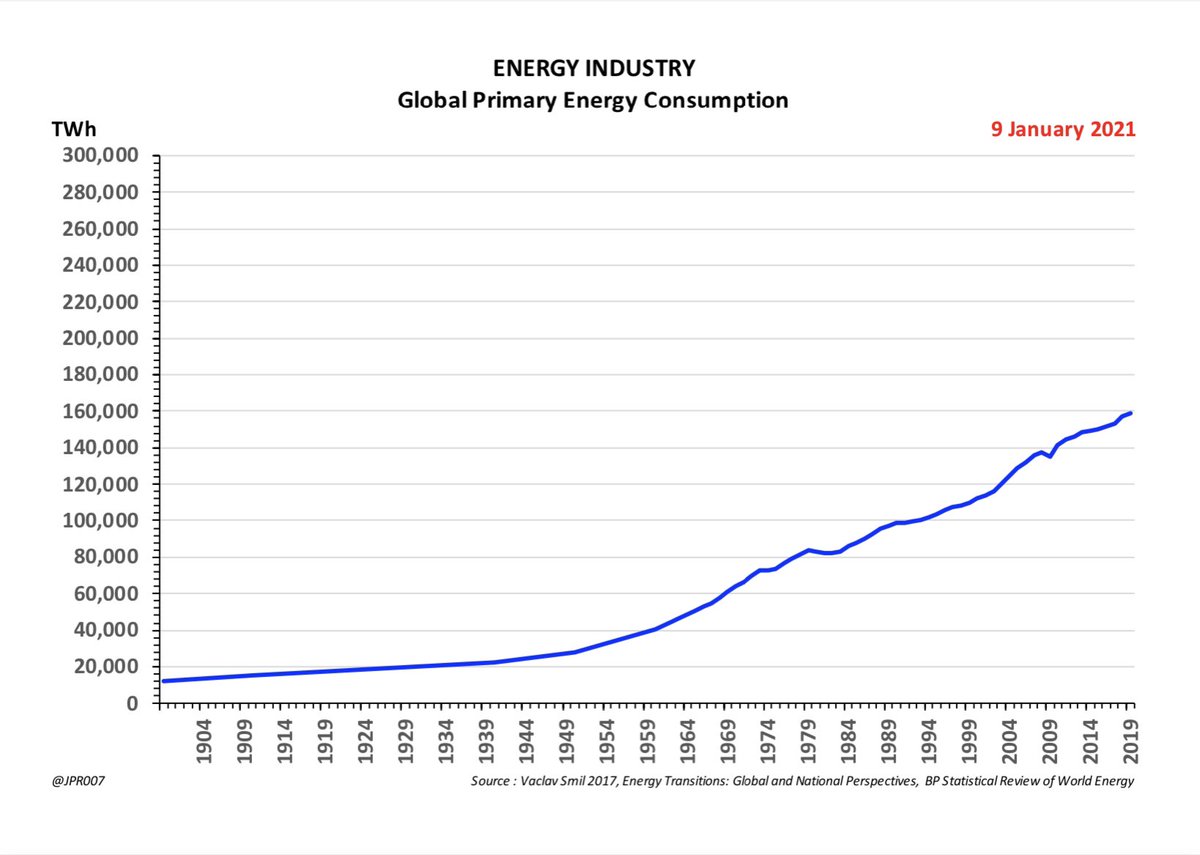
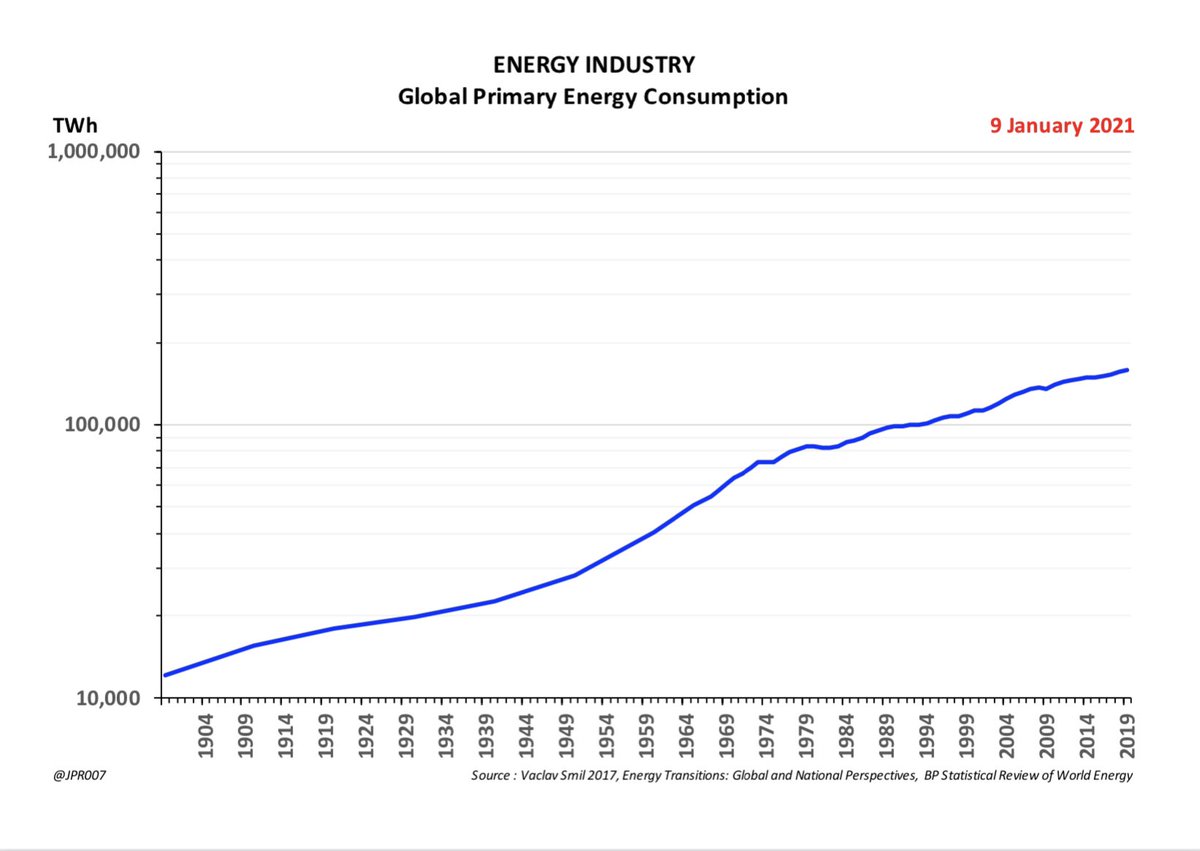
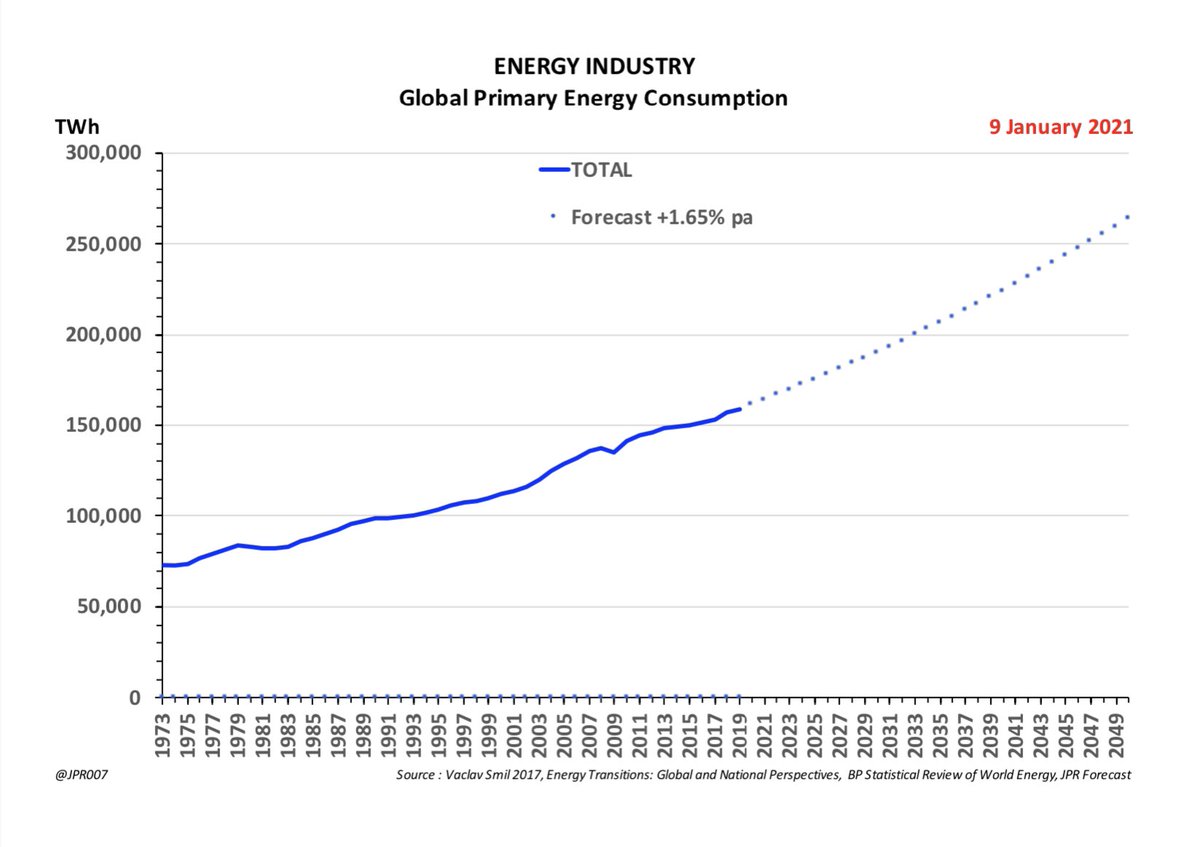
9. During the last 120 years our primary energy consumption has grown from 12,100 TWh per year in 1900 up to 158,839 TWh per year in 2019, or an increase of 13.1x
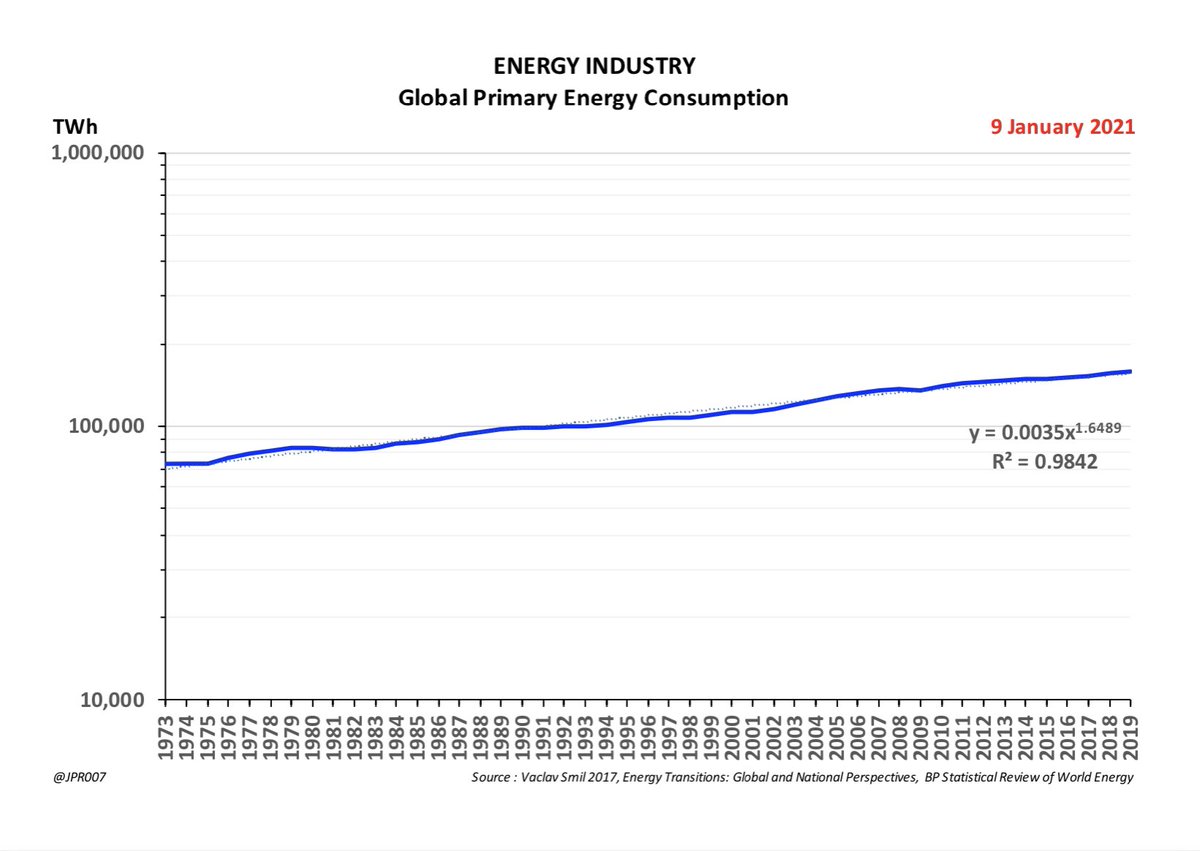
10. Since 1973 the growth rate of our global energy consumption has slowed down as we have learned to use these vast amounts of energy more efficiently and more cleanly
11. And the trend-line growth rate has been about +1.65% per annum
- which is almost half of the growth rate of Global GDP which runs at about +3.0% per annum on a trend-line basis
- which is almost half of the growth rate of Global GDP which runs at about +3.0% per annum on a trend-line basis
12. We can use this to extrapolate the growth in our primary energy consumption if nothing were to change in our current habits and practices
- and the result would be a consumption rate of TWh 263,800 per year by 2050, or 1.66x higher than the current level as of 2019
- and the result would be a consumption rate of TWh 263,800 per year by 2050, or 1.66x higher than the current level as of 2019
13. Which takes us back to our original diagram
This chart tells us that we are consuming 534,000 PJs of primary energy
- but we are only getting 210,000 PJs of useful work out of that
- and 58% of what flows through the system is getting wasted as Rejected Energy
This chart tells us that we are consuming 534,000 PJs of primary energy
- but we are only getting 210,000 PJs of useful work out of that
- and 58% of what flows through the system is getting wasted as Rejected Energy
14. This Rejected or wasted Energy is largely a consequence of using Fossil Fuels in heat-cycle engines
- where the laws of physics dictate natural limits to energy conversion efficiency
- where the laws of physics dictate natural limits to energy conversion efficiency
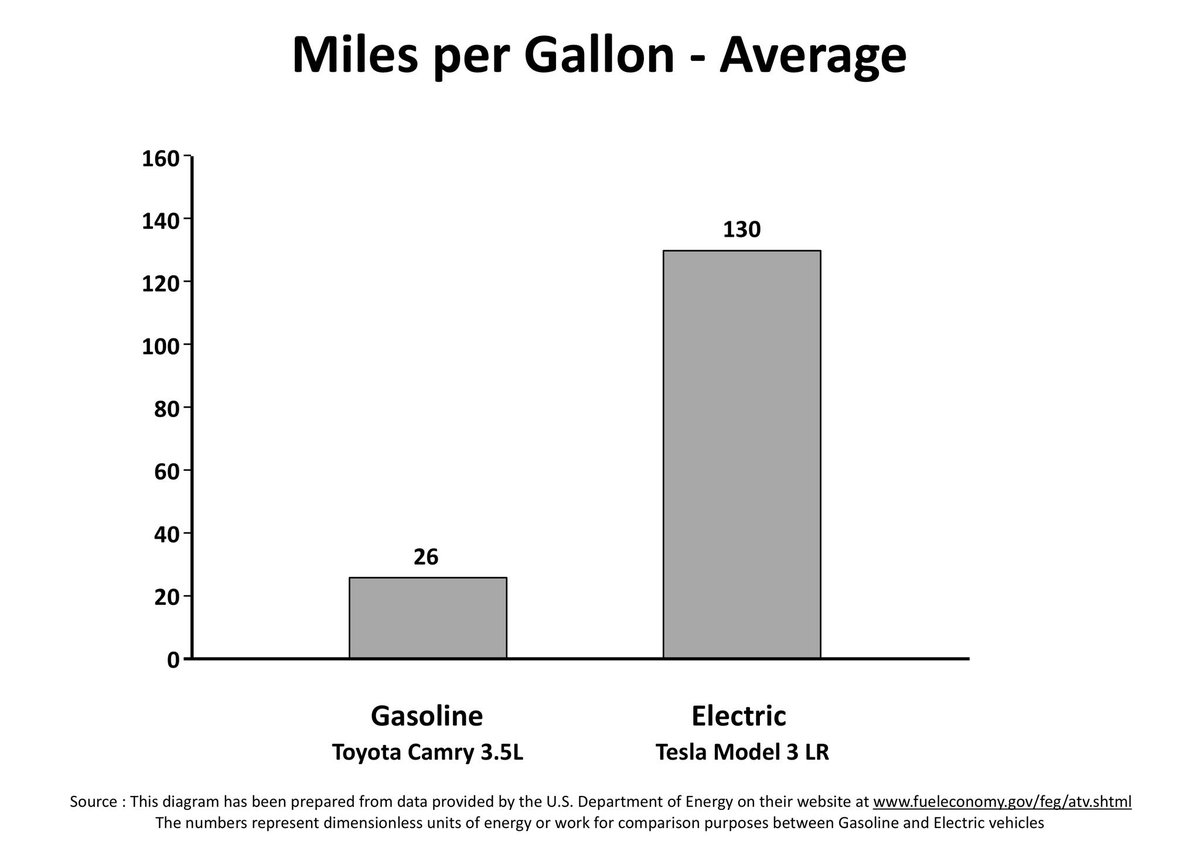
15. Using Electricity in place of Fossil Fuels completely changes this picture
- we can achieve the same functional outcomes with dramatically less energy consumption because less input energy is rejected as waste heat
- we can achieve the same functional outcomes with dramatically less energy consumption because less input energy is rejected as waste heat
16. And this can be true across many of the use cases where we consume Energy
- with Transportation as the single biggest area of opportunity
- with Transportation as the single biggest area of opportunity
17. The opportunity exists to reduce our Primary Energy footprint by -50% or more
- which can make a huge difference in many ways even with the natural growth in our Energy needs
- which can make a huge difference in many ways even with the natural growth in our Energy needs

 Read on Twitter

