Update on PDFs built in Python off of OSAM Database
Wanted to share some improvements in code discussed below. Note: Thread contains links to PDFs covering Japan Large Cap and Large Cap Value Indices from Dec 1988 to Sep 2020, each ~16MB, 63 slides. Some pretty wild charts. https://twitter.com/Jesse_Livermore/status/1339035127700213761
Wanted to share some improvements in code discussed below. Note: Thread contains links to PDFs covering Japan Large Cap and Large Cap Value Indices from Dec 1988 to Sep 2020, each ~16MB, 63 slides. Some pretty wild charts. https://twitter.com/Jesse_Livermore/status/1339035127700213761
In addition to domestic universes, code can now analyze stocks in: (1) foreign developed universe, (2) emerging market universe. Maximum coherent start date for those is mid 1980s, versus late 1950s for domestic.
Additional new features: (3) Capability to build & analyze indices of dynamic user-defined factors (previously limited to stable partitions) and (4) vintages (image of an index at a point in time that is held constant going fwd, w/o ever being rebalanced) ( @econompic favorite).
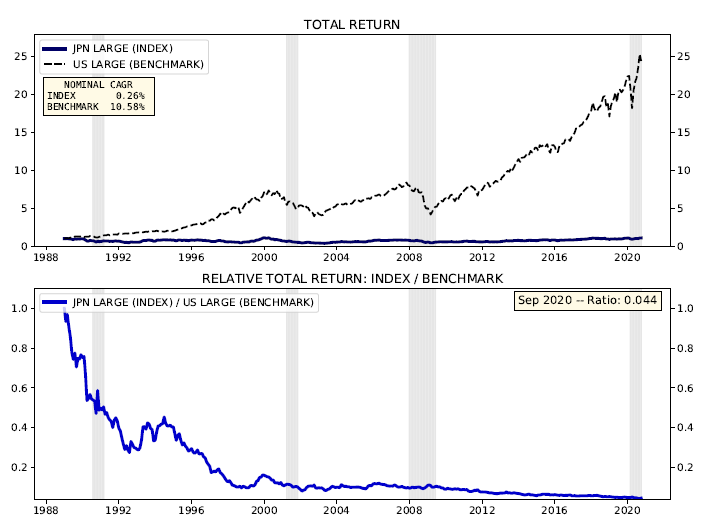
Slides are now stacked in two's or three's to conserve space. Default benchmark is the universe of stocks that your index was built from, *minus* the stocks in your index. In this instance, I manually set the benchmark to be U.S. Large Caps, to compare the different fates.
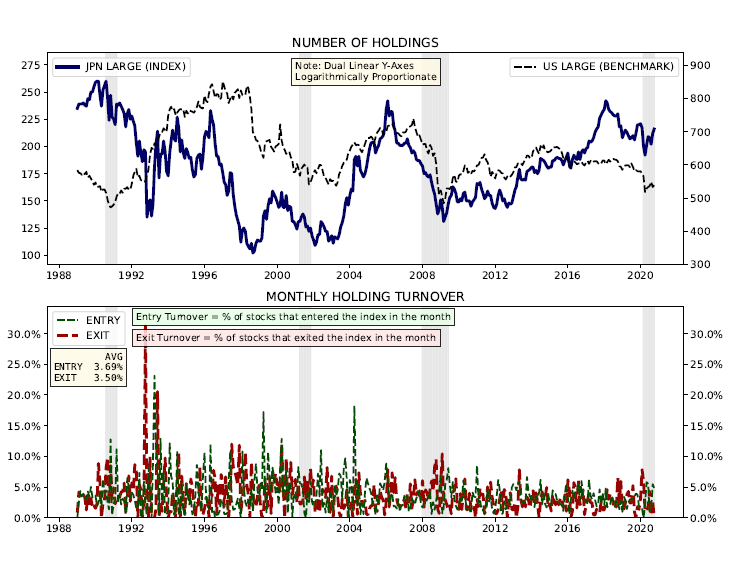
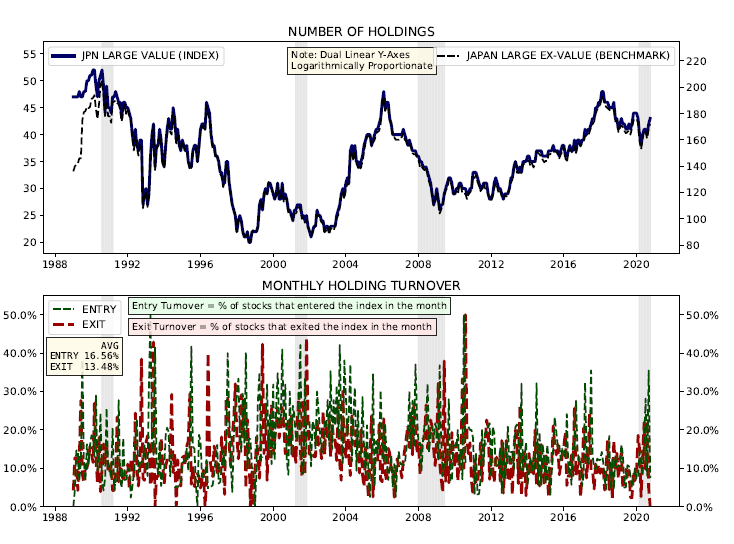
Top chart is # holdings for index and bench. Lines are ~ identical in this case b/c Value is just a quintile of the larger universe, and the dual y-axes are log-proportionate. New feature is bottom slide, monthly "entry" & "exit" turnover of index. Obviously higher for Value.
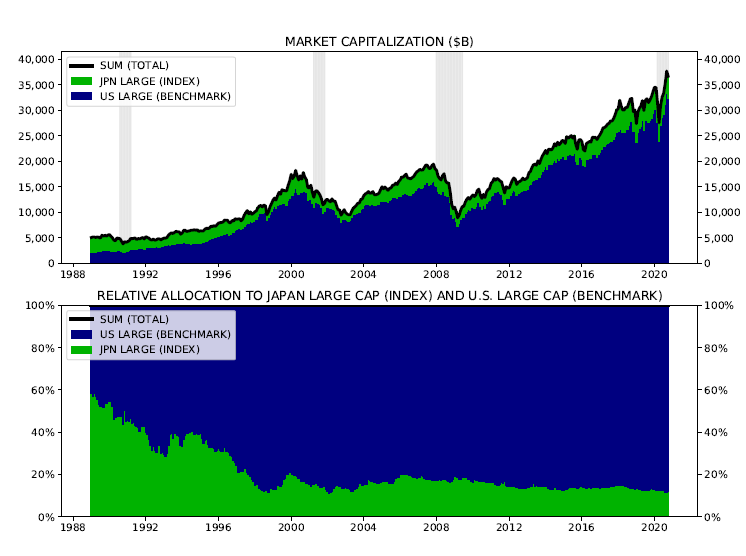
Market Capitalization of Japan Large and US Large, in absolute terms and in terms of relative allocation. Obviously a huge allocation to Japan by size at the peak of the bubble, steady move lower from there.
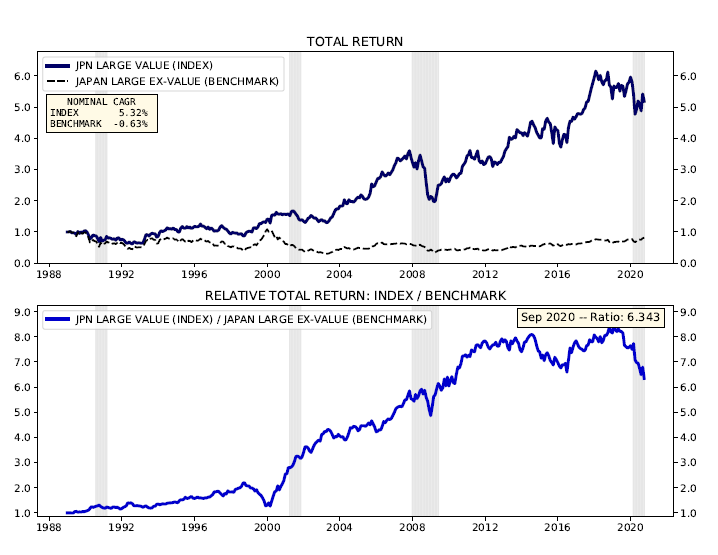
But notice the difference* that a value overlay provided in Japan. Top Value Quintile delivered +6% over benchmark (defined as Japan Large Caps *minus* Top Value Quintile). Of course, that's on a monthly rebalance, implementation cost not reflected.
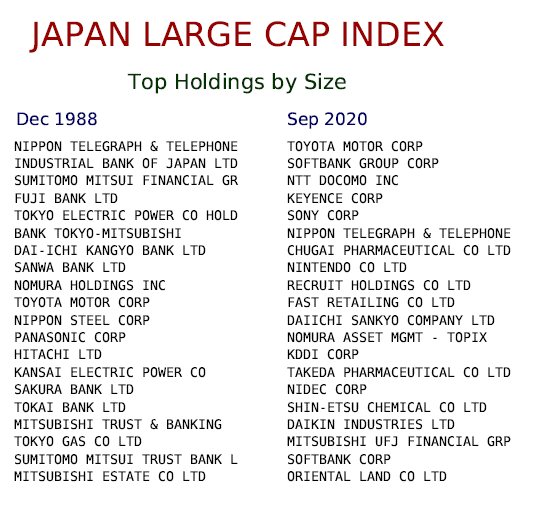
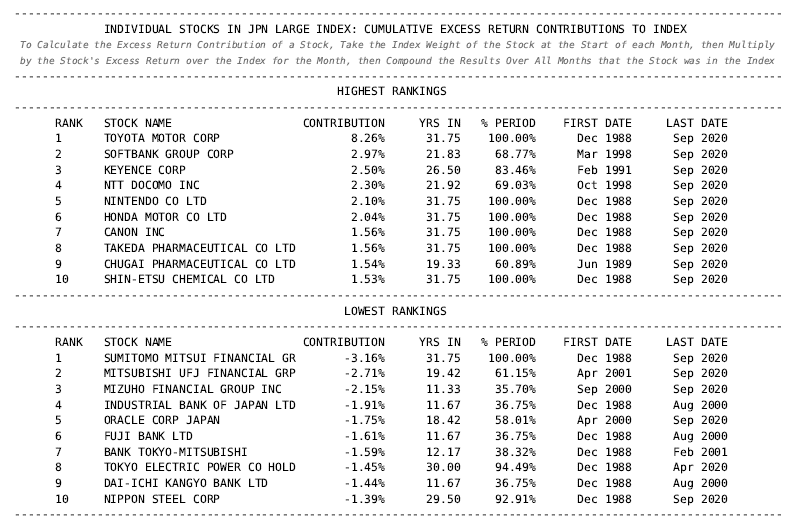
Top contributors and detractors to Japan Large Cap Index. Notice concentration of proverbial "zombie" banks in lower column.
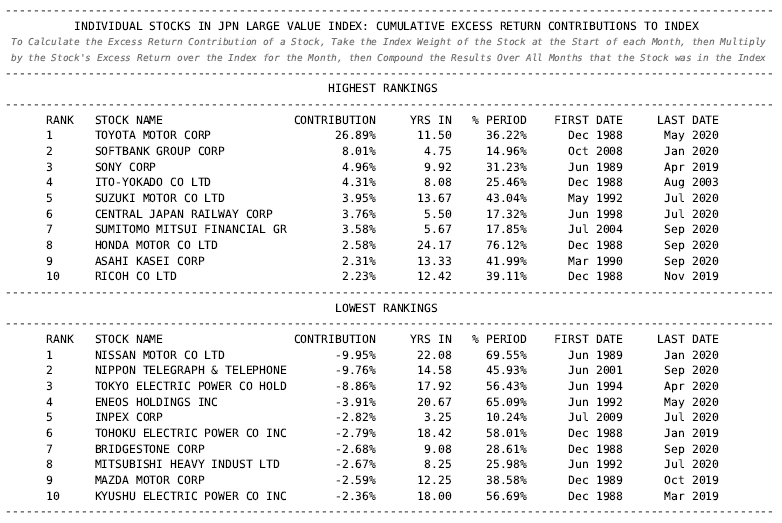
Same table, but for Japan Value. The % Period column tells you how much of the period the stock spent inside the Value index. One of the stocks most frequently in the Value index was Honda Motor, spending 24.17 years, or 76% of the full period, inside it, as a value stock.
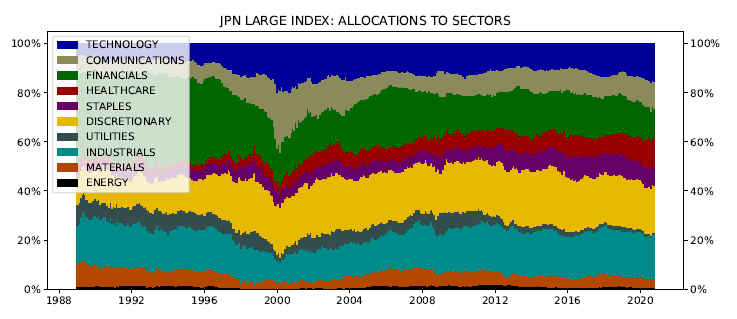
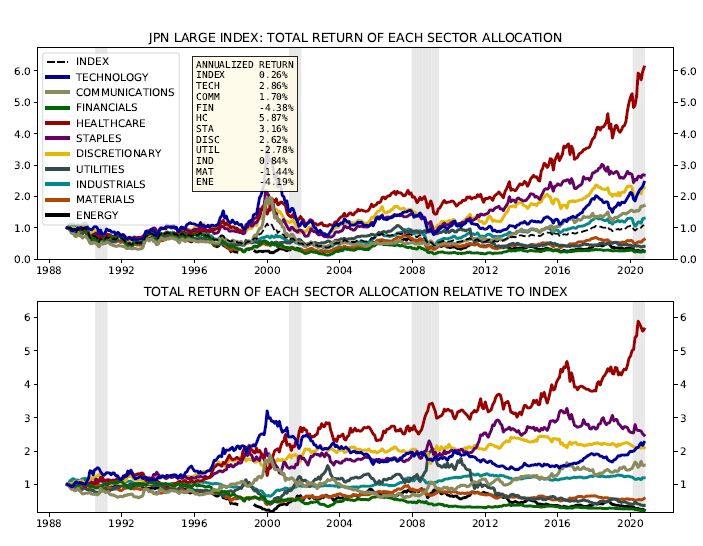
Japan Large Cap sector allocations and the performance of those allocations, in absolute terms and relative to the overall index.
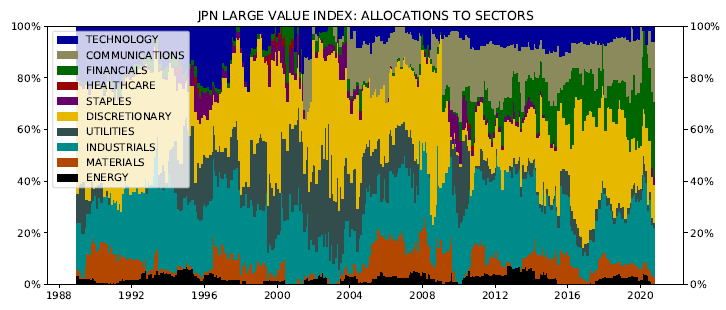
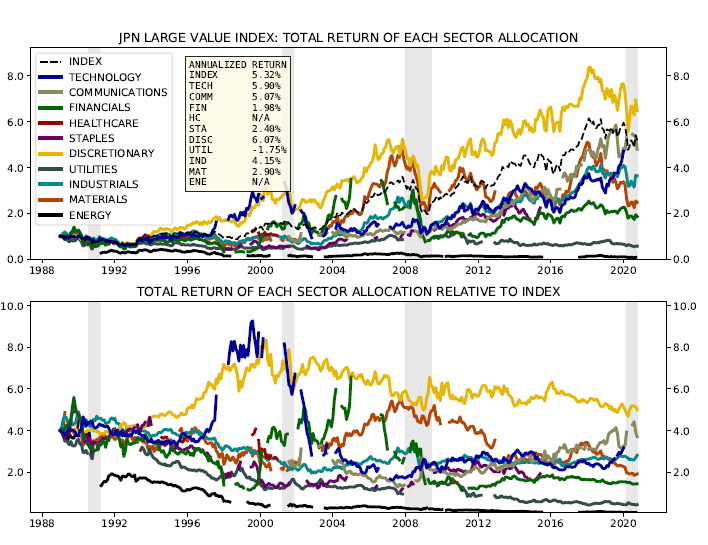
Same charts of sectors allocation and performance, but for Japan Value. Reduced technology exposure, but also little increase in Energy or Materials, unlike US. Lots of Consumer Discretionary and Industrial. Virtually no Healthcare. Note all returns are USD denominated.
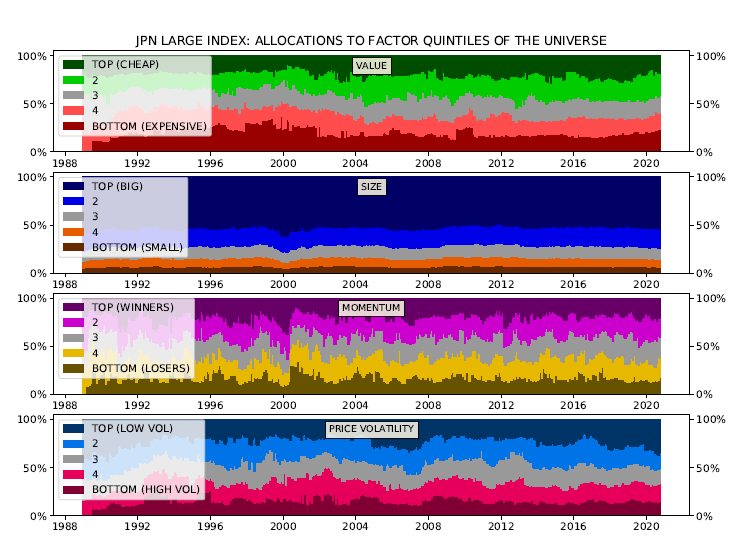
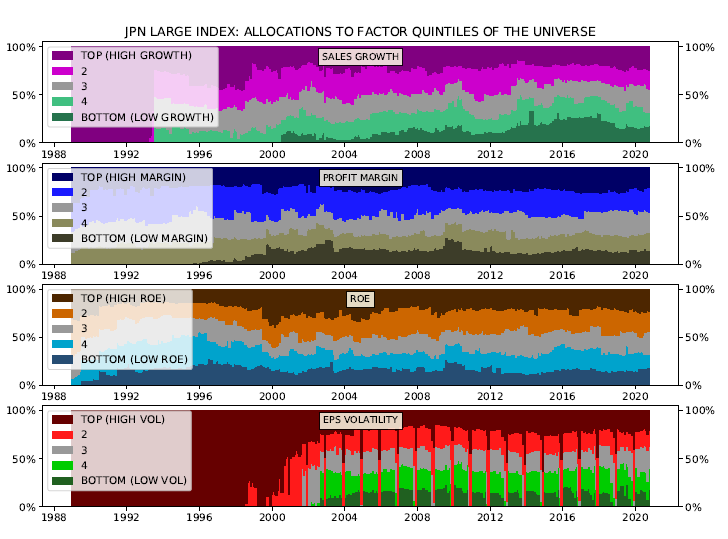
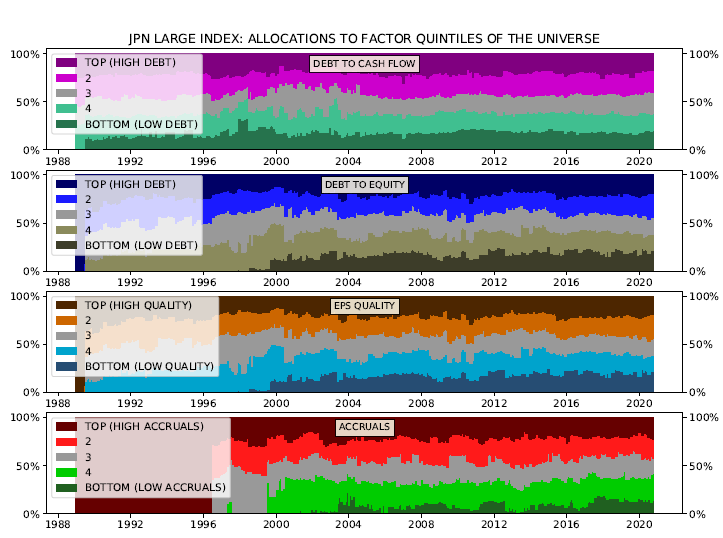
Took the factor allocations and stacked them on each other, four apiece, to save space. Also added 9 new factor selections, defined by the user. Here are 12 factor allocations for Japan Large:
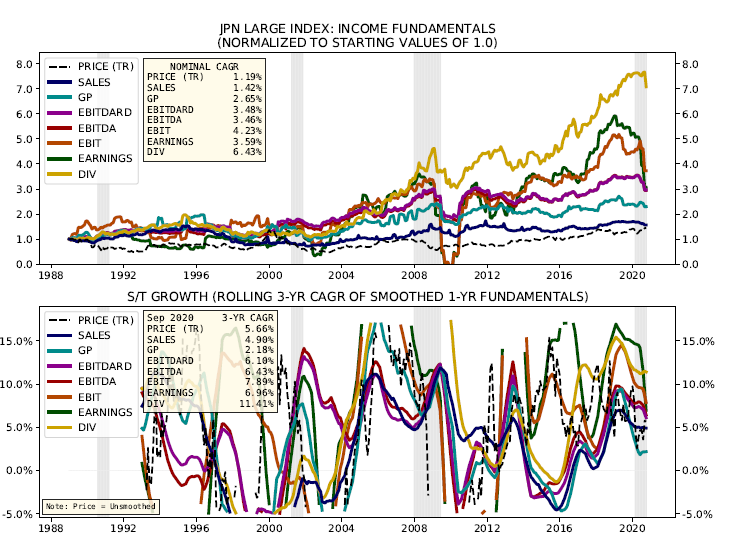
Stacked the fundamental growth charts on top of each other. Here is Japan Large. Notice the strong growth in fundamentals relative to price, which has stalled. Especially strong dividend growth, in '03-'07 cycle and then after Abenomics.
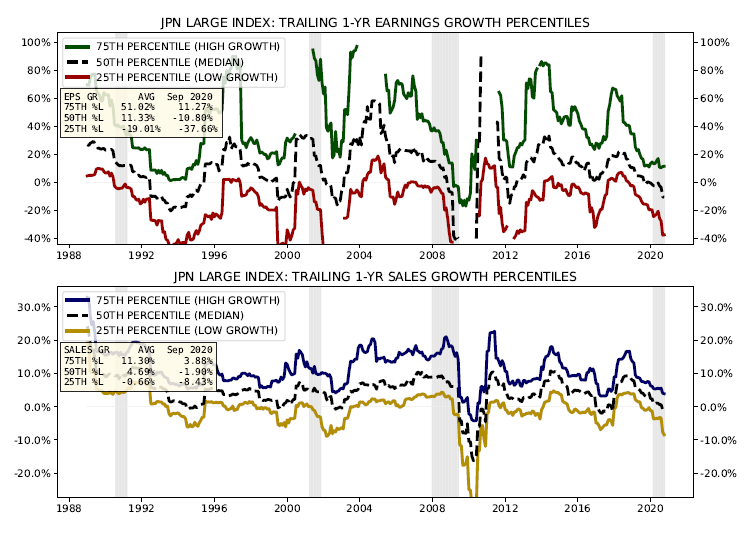
Also added charts of earnings growth and sales growth percentiles within the index over time. Here is Japan Large Cap:
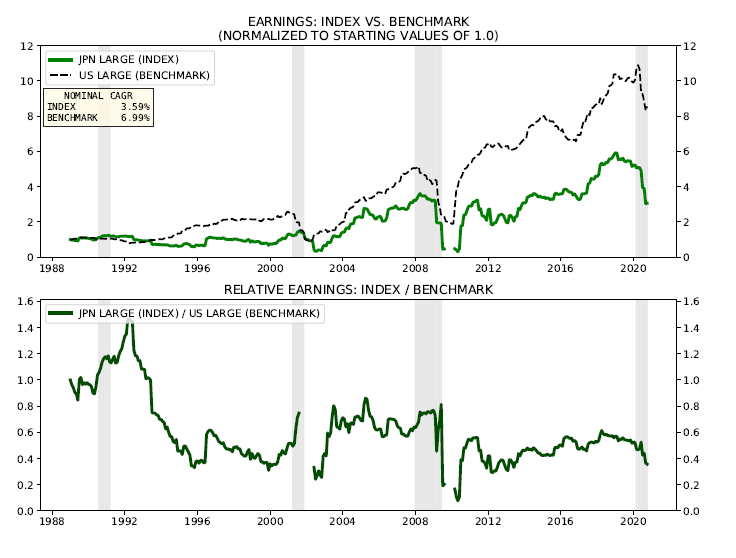
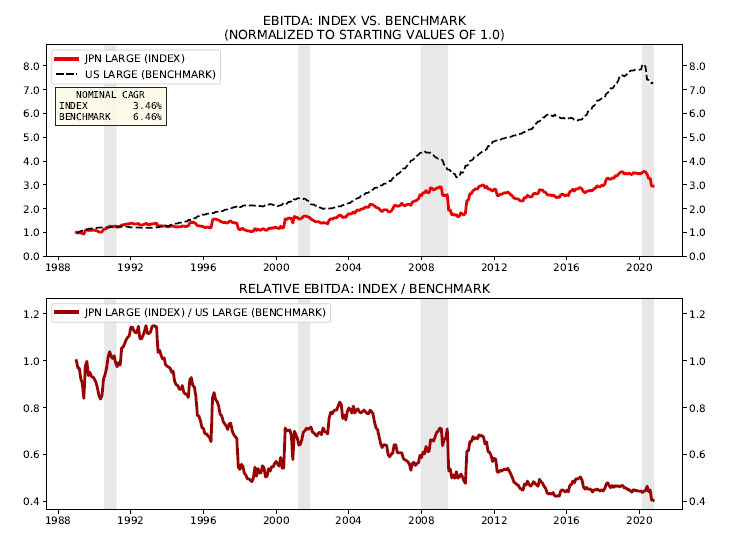
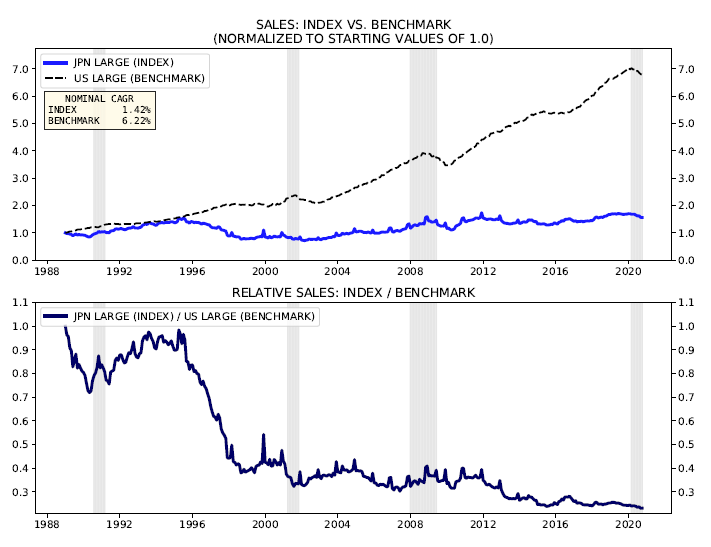
Here's Earnings, Ebitda and Sales growth for index (Japan Large) compared to the benchmark (US Large). Top is both side by side, bottom is one divided by the other. US has not just massively outperformed on price, but also on fundamentals, including after ccy translation.

 Read on Twitter