$MSTR and #Bitcoin  relationship update through yesterday's close.
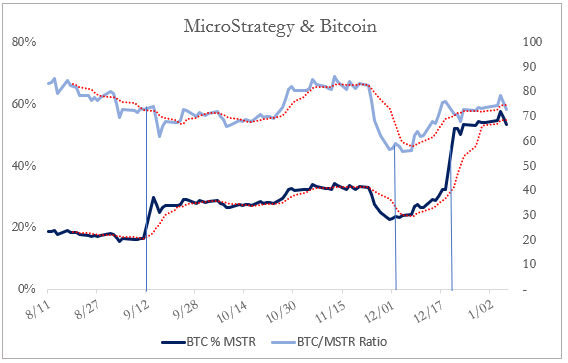
First vertical line is when they increased BTC holdings from 21,454 to 38,250. Second is when they increased to 40,824 and third to 70,470.
 relationship update through yesterday's close.
First vertical line is when they increased BTC holdings from 21,454 to 38,250. Second is when they increased to 40,824 and third to 70,470.
Dark blue line = BTC holdings as % of market cap (currently 53.44%). Think of this as $1 of MSTR = $0.5344 of underlying BTC.
Light blue line = ratio of BTC/price of MSTR shares. A higher ratio implies a lower premium being put on MSTR shares for the underlying Bitcoin exposure
Light blue line = ratio of BTC/price of MSTR shares. A higher ratio implies a lower premium being put on MSTR shares for the underlying Bitcoin exposure
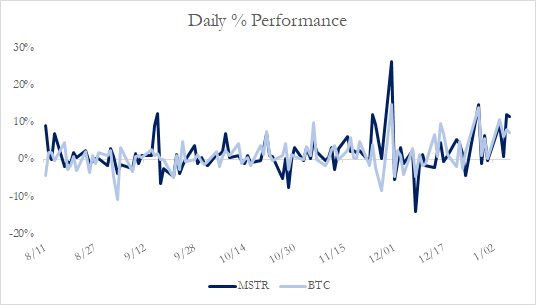
The two asset's daily return are becoming increasingly correlated. Both ratios above are two simple ways to quickly gauge the current premium investors are willing to pay for MSTR's underlying BTC holdings. Will be interesting to see how this relationship plays out into 2021+
@MicroStrategy is simply a software and data analytics company that has very deliberately adopted #Bitcoin  as part of their long term corporate reserve strategy.
Read more about @michael_saylor journey down the #Bitcoin rabbit hole here


 https://link.medium.com/yfSEdn1Oxcb
 as part of their long term corporate reserve strategy.
 Read more about @michael_saylor journey down the #Bitcoin
 rabbit hole here

 https://link.medium.com/yfSEdn1Oxcb
@edstromandrew @meatportmusic @michael_saylor @PrestonPysh @CitizenBitcoin @JanWues @PsychedelicBart @martys_owl
Red dots = 7 day moving average for both

 Read on Twitter


