There are some interesting, but not conclusive, observations to be drawn from looking at the proportion of people who have SARS-CoV-2 antibodies in different regions.
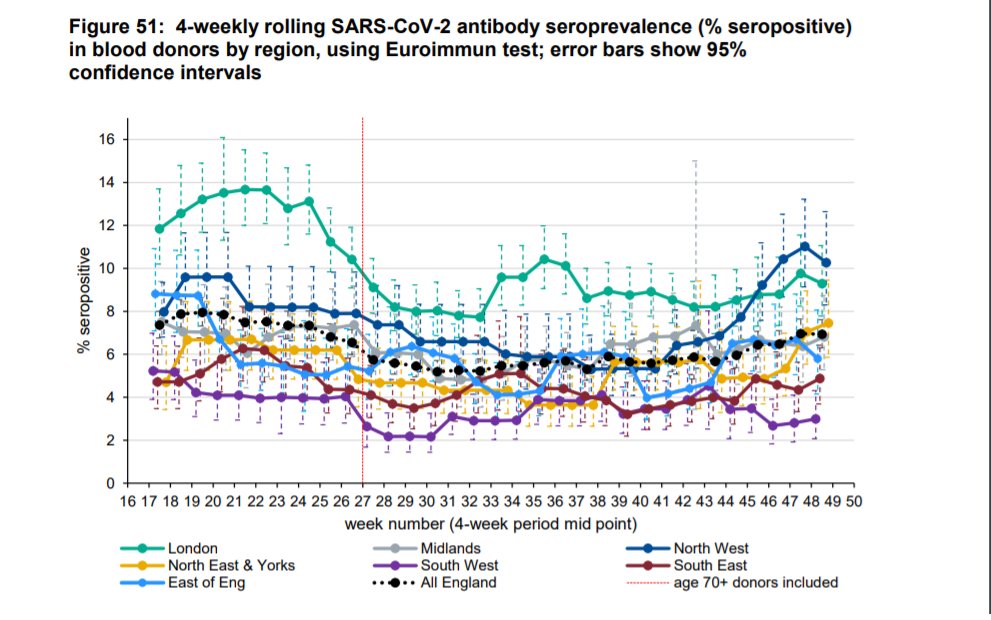
According to PHE, in the 10 weeks up to week 49 (the last date with data) SARS-CoV-2 antibody prevalence changed as follows:
- in the NW it increased from ~5.5 to ~10.3 %
- in London it was roughly flat, at around 9%
- in the NW it increased from ~5.5 to ~10.3 %
- in London it was roughly flat, at around 9%
I have estimated these by eye from the graph at page 68 of:
https://assets.publishing.service.gov.uk/government/uploads/system/uploads/attachment_data/file/950424/Weekly_Flu_and_COVID-19_report_w1_FINAL.PDF
https://assets.publishing.service.gov.uk/government/uploads/system/uploads/attachment_data/file/950424/Weekly_Flu_and_COVID-19_report_w1_FINAL.PDF
It had been previously postulated by @RealJoelSmalley and others that the pandemic was essentially over in London in June (after which time Covid became endemic), but there had been a genuine mini 2nd wave of Covid in Autumn in the NW and NE/Yorkshire.
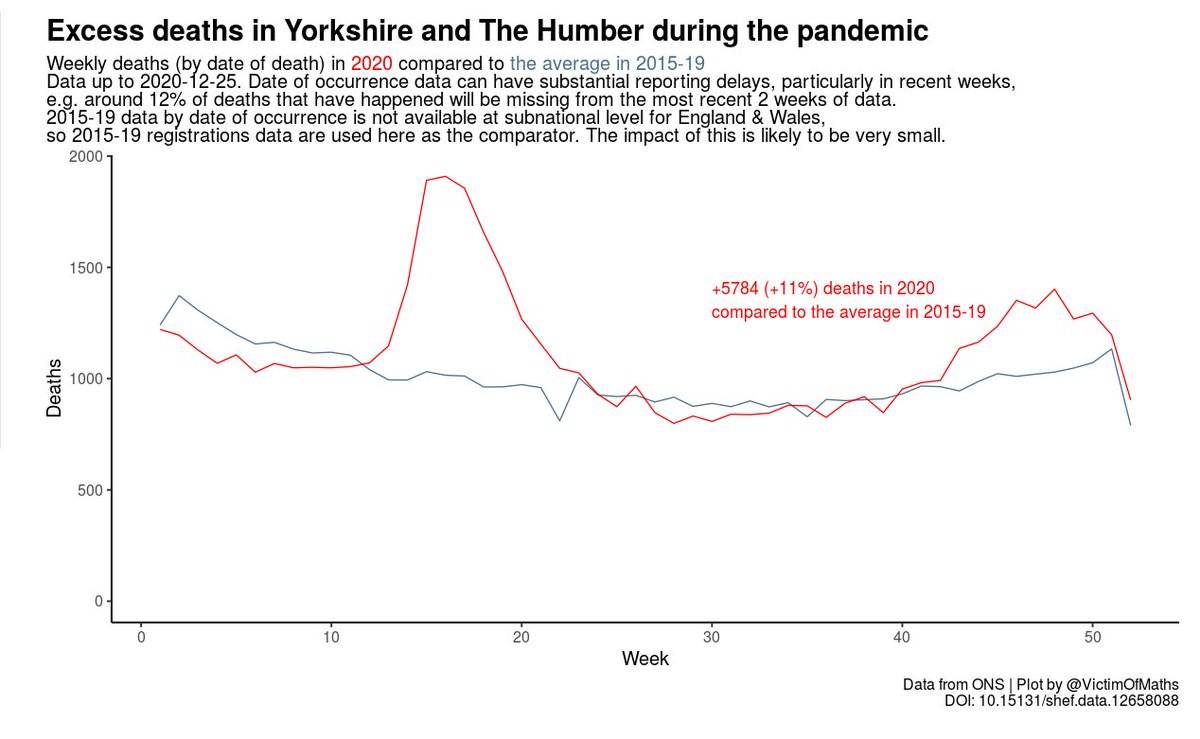
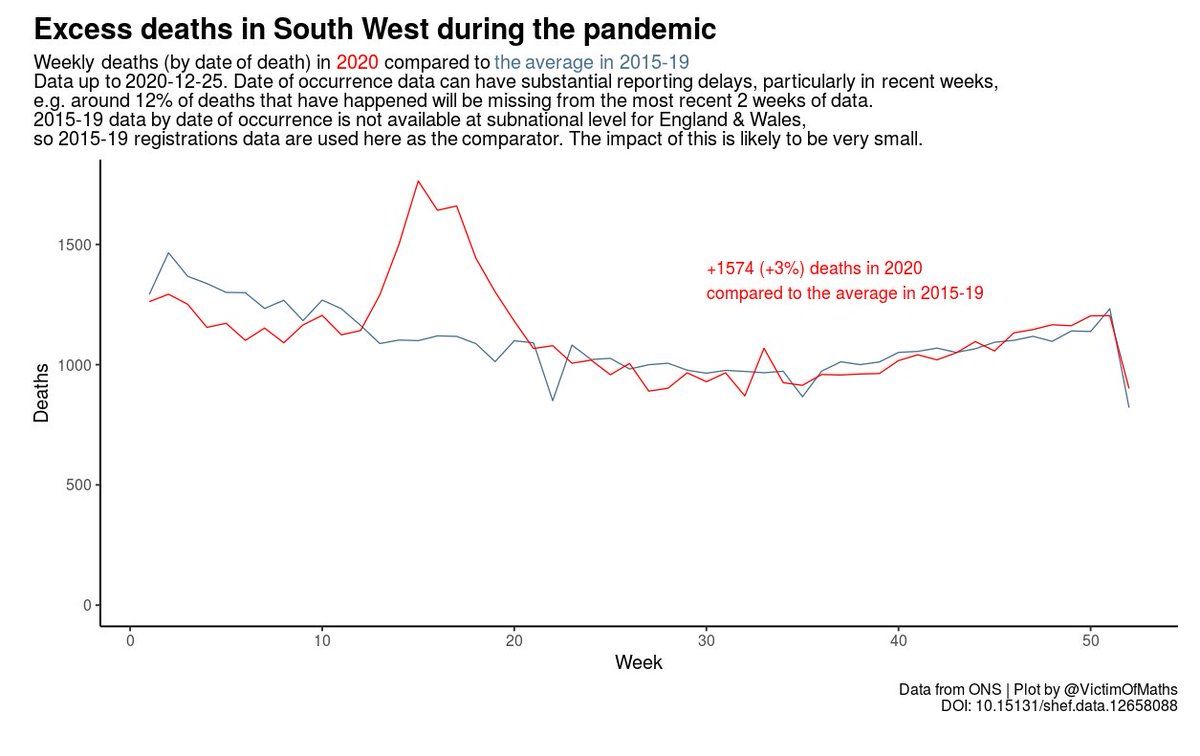
Interestingly, this is borne out by excess mortality graphs:
In London, there has been no excess mortality since the week 33 heatwave.
In London, there has been no excess mortality since the week 33 heatwave.
What about other regions?
Yorkshire and NE seropositivity also nearly doubled over that period.
Here is Yorkshire / Humber excess deaths:
Yorkshire and NE seropositivity also nearly doubled over that period.
Here is Yorkshire / Humber excess deaths:
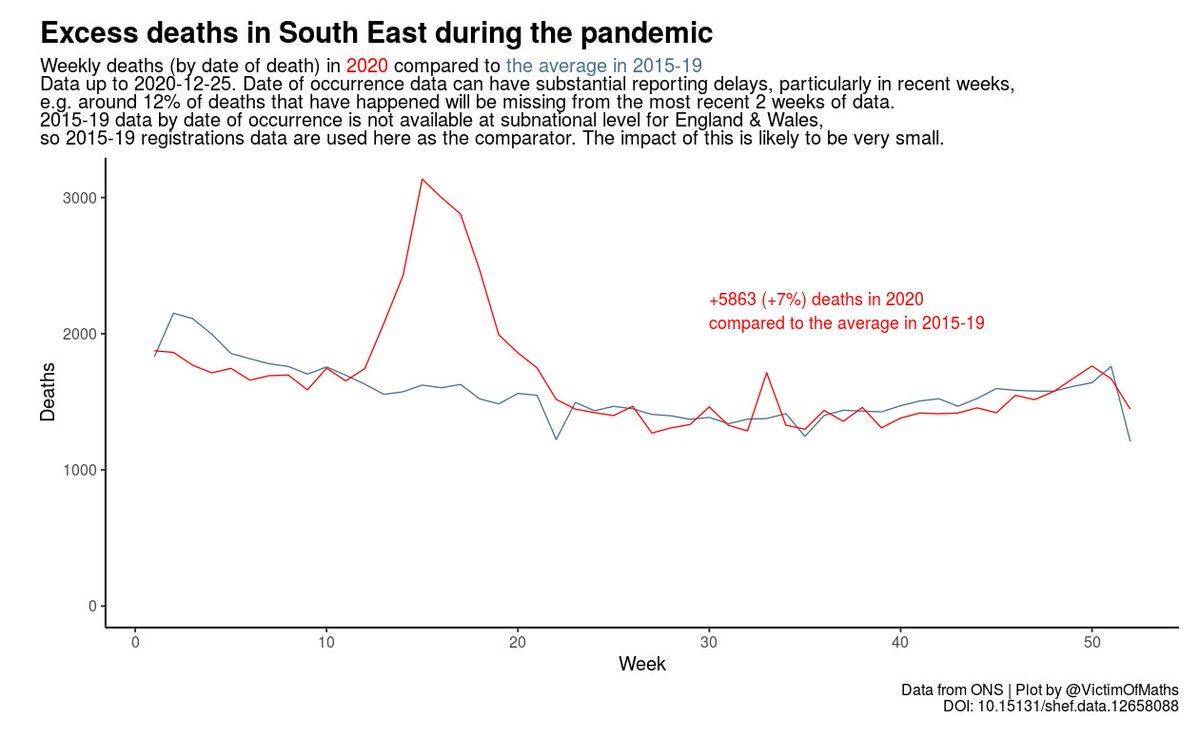
SE region - largely flat seropositivity in last few months.
Excess deaths - none since the heatwave.
Excess deaths - none since the heatwave.
Midlands region (flat seropositivity), at first glance maybe doesn't fit the above, but I note that the excess death appears to have been a recent phenomenon so maybe insufficient time to seroconvert?
Excess in East Mids:
Excess in East Mids:
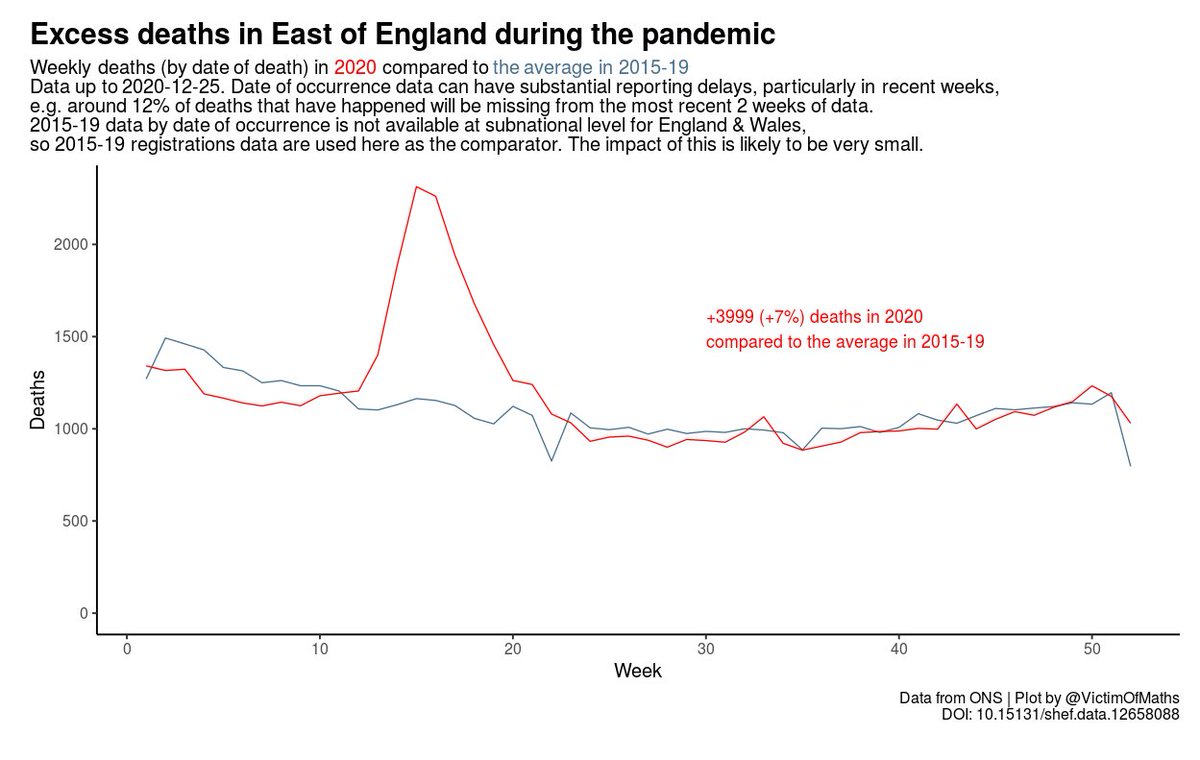
Finally, in the East of England, seropositivity was down then up a bit over the period, but broadly flat.
Excess deaths:
Excess deaths:

 Read on Twitter