I decided to start covering changes on Toronto rental market on a monthly basis from now on.
Twitter has an abundance of resale stats, but very limited exposure to rental stats.
This post covers entire turbulent events of 2020 on rental market.
#tore #onre #Toronto #CondoCrash
Twitter has an abundance of resale stats, but very limited exposure to rental stats.
This post covers entire turbulent events of 2020 on rental market.
#tore #onre #Toronto #CondoCrash
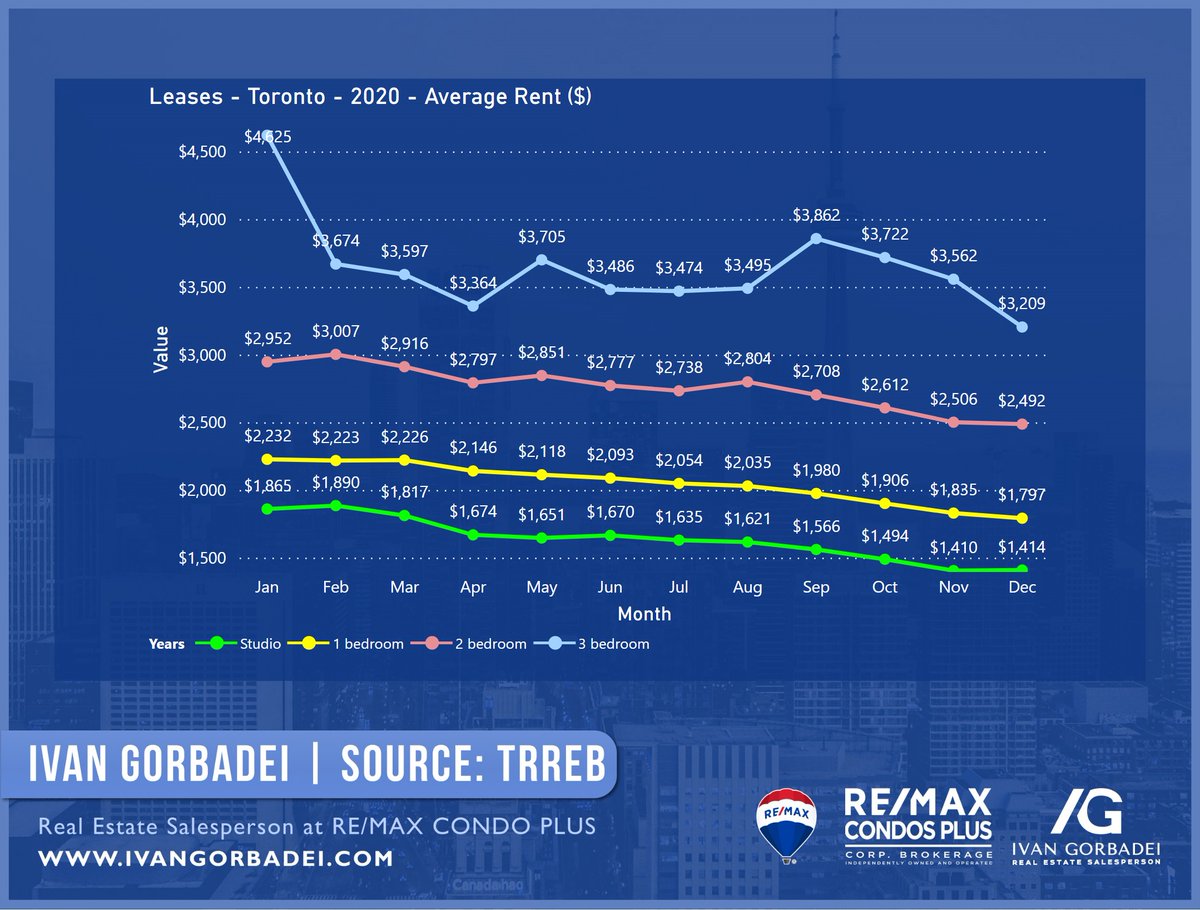
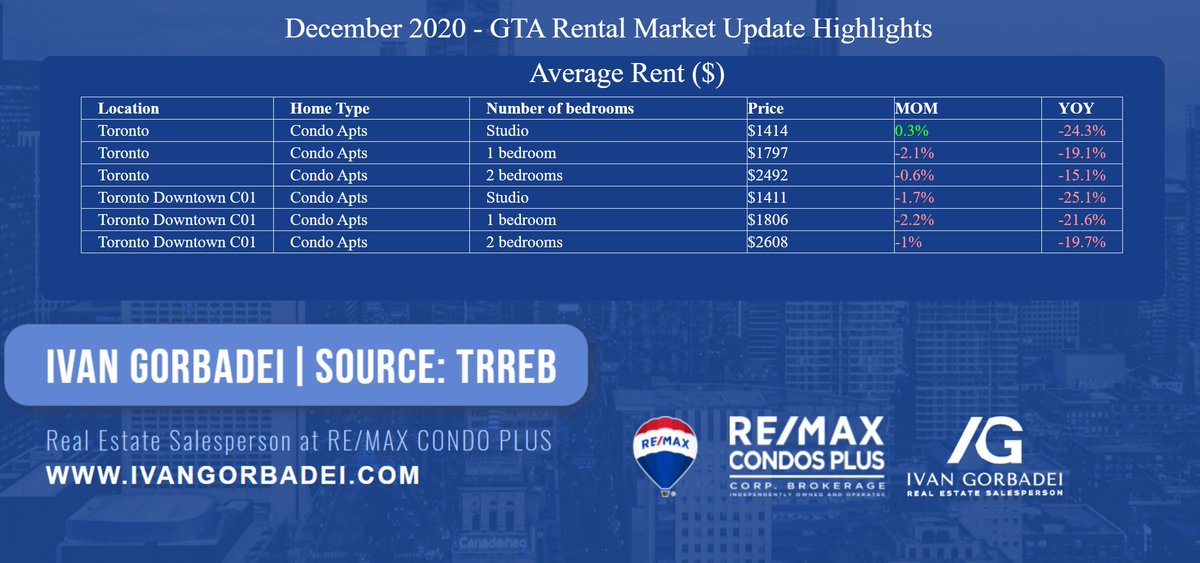
I could post zillion of metrics like rental MOI, active listings, etc,but since it is a first post in this subject, I'll narrow it down only to story about rental prices in 2020 under different angles
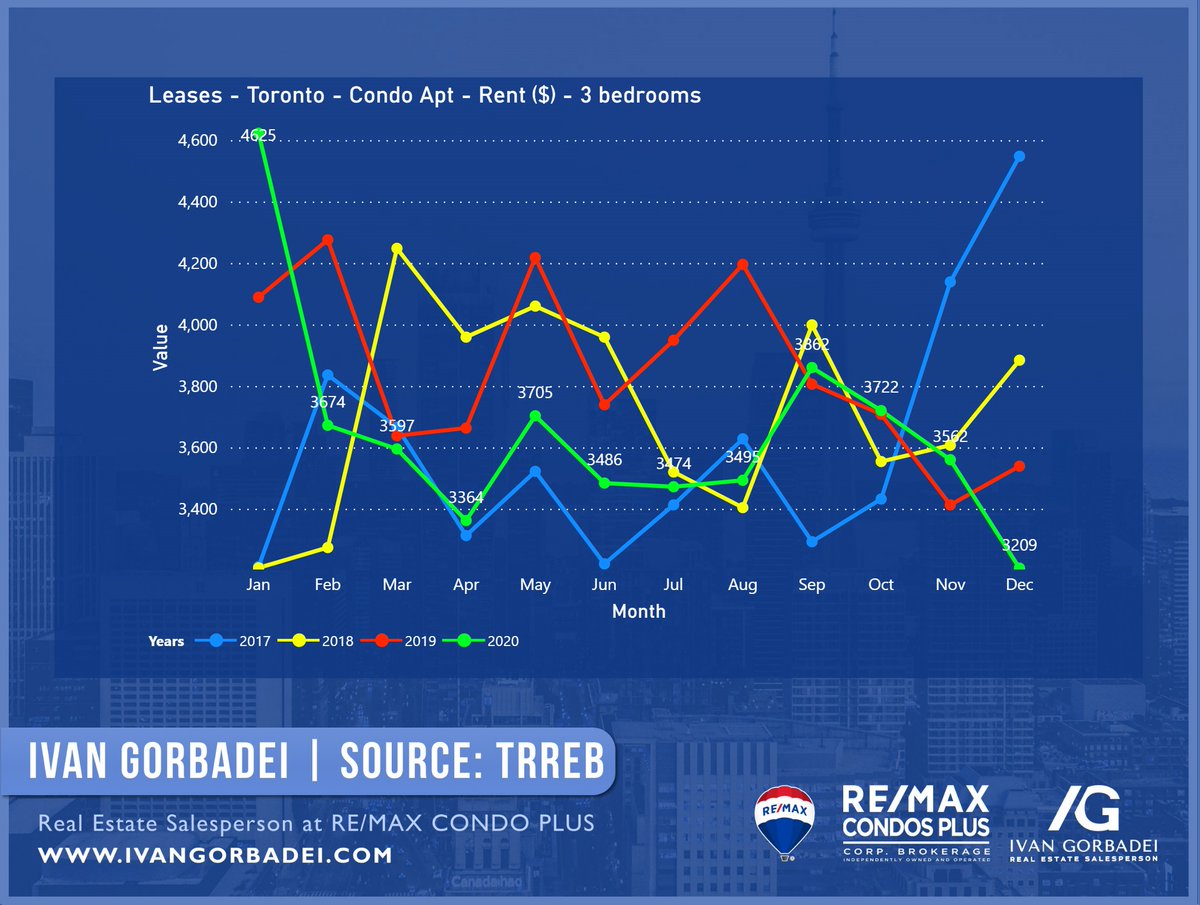
The two images below are summary of what happened, split by number of bedrooms
The two images below are summary of what happened, split by number of bedrooms
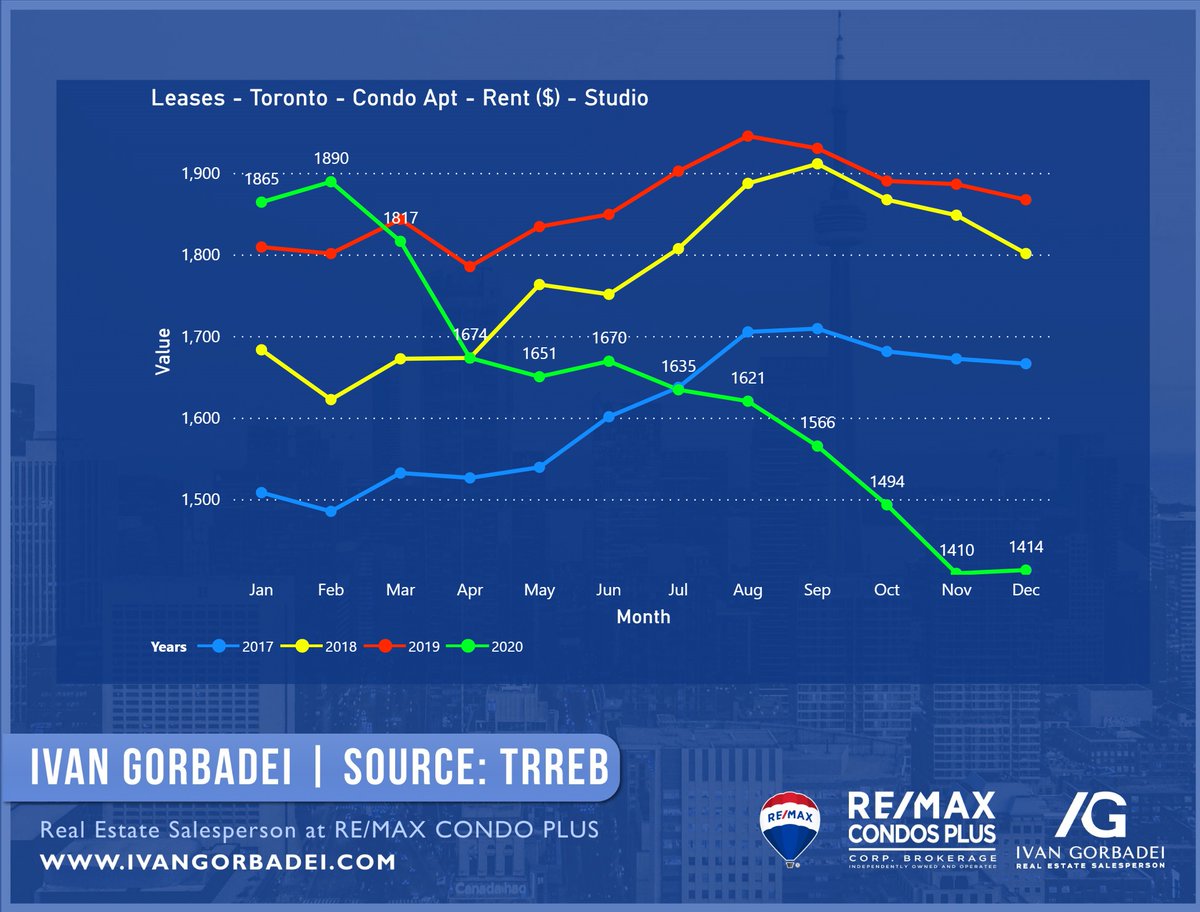
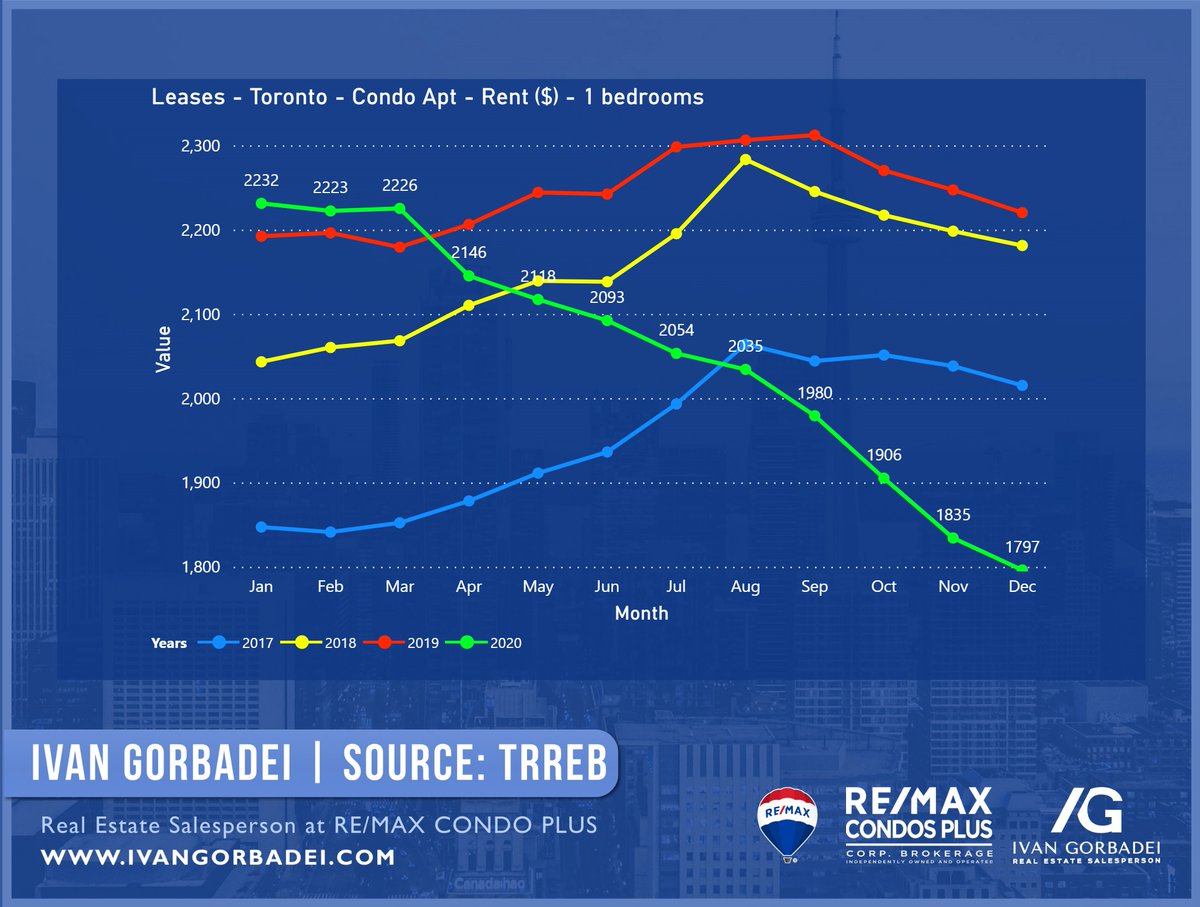
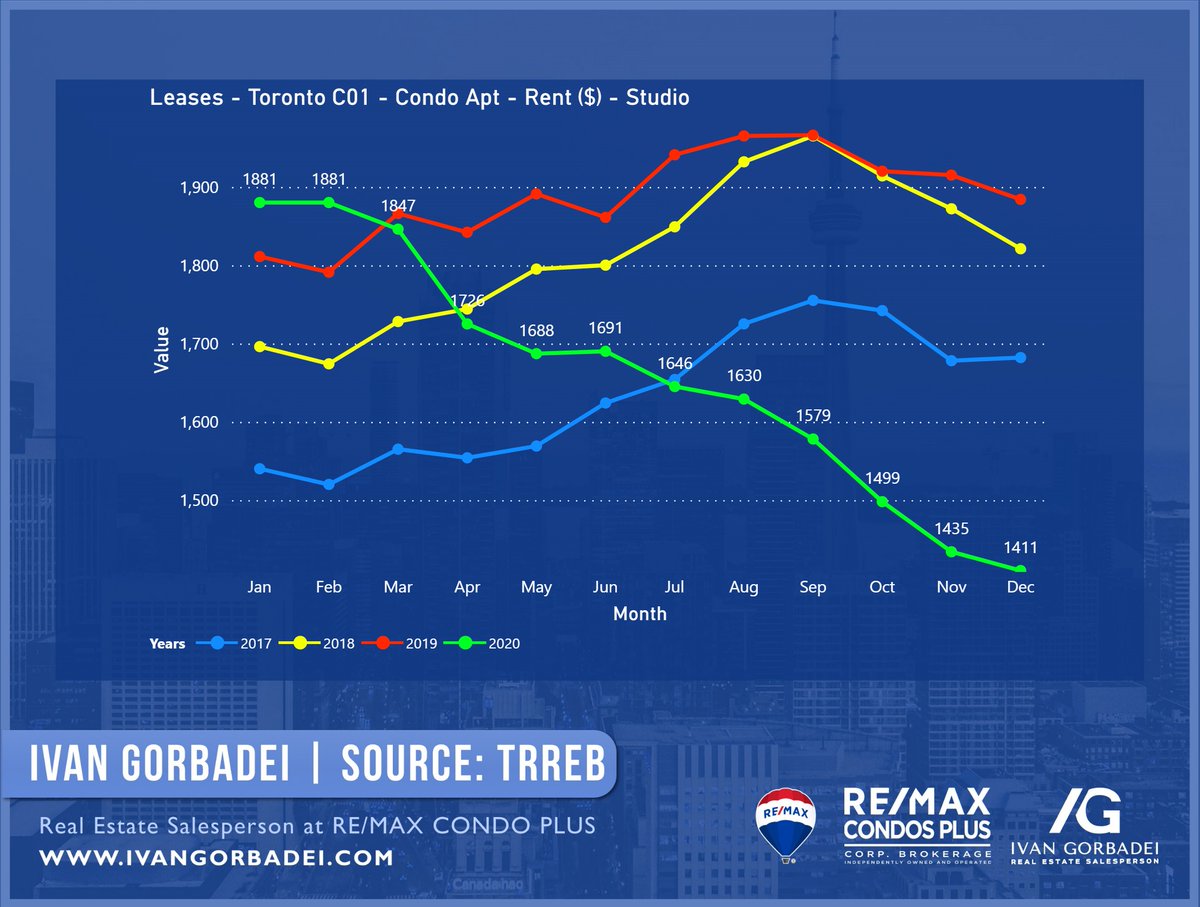
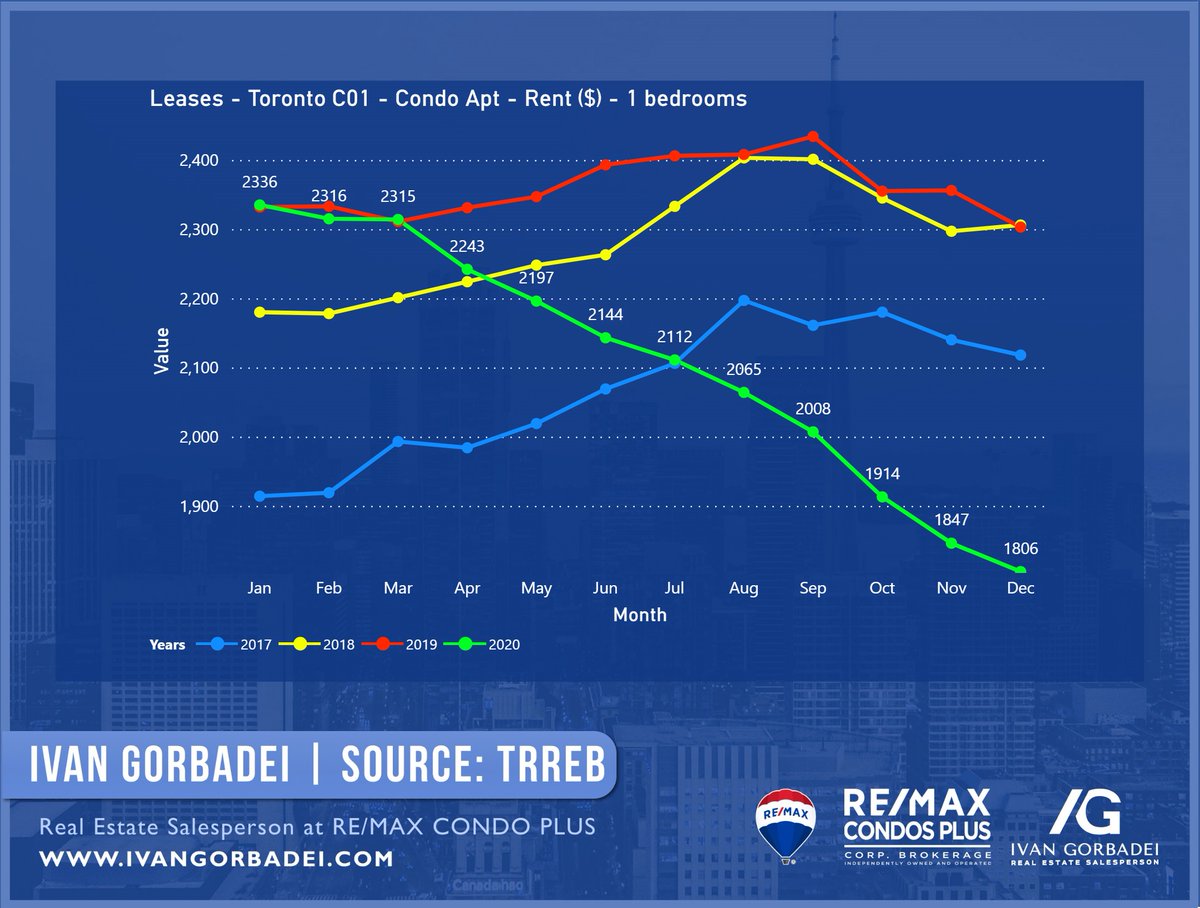
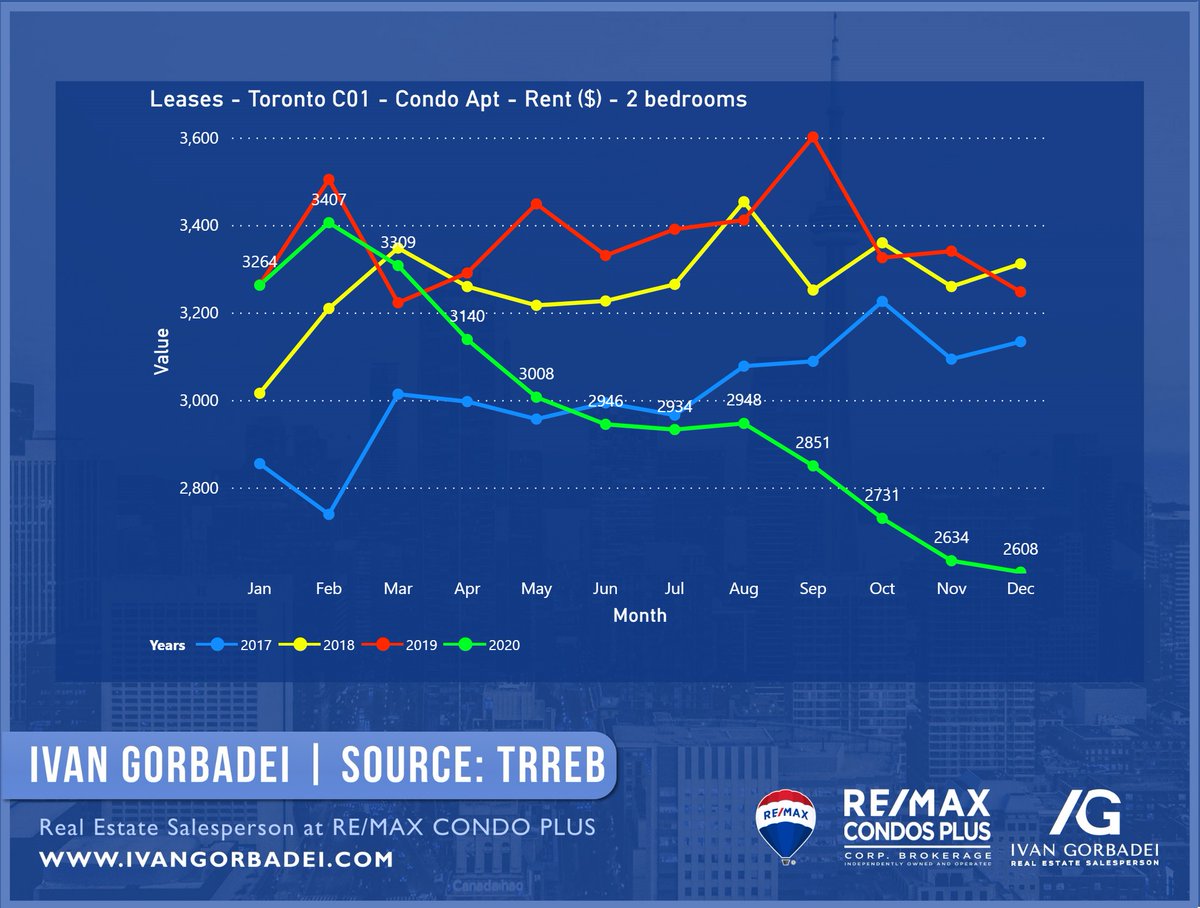
Rents in entire Toronto were falling throughout 2020 and the charts below show exactly how different it was compared to previous years.
Each chart is responsible for studios, 1BR and 2 BR units here.
The interesting part to notice is that studios stopped falling in Dec 2020.
Each chart is responsible for studios, 1BR and 2 BR units here.
The interesting part to notice is that studios stopped falling in Dec 2020.
Toronto downtown (C01 district) has its own specifics for rents compared to Toronto overall.
The charts below are for Toronto C01 district only.
The charts below are for Toronto C01 district only.
I like what @benmyers29 has been doing for analyzing rental trends for rentalsdotca data.
The data I am working with is coming from MLS with some manual preparation.
Always opened for the feedback and let me know what you think in the comments please!
The data I am working with is coming from MLS with some manual preparation.
Always opened for the feedback and let me know what you think in the comments please!

 Read on Twitter
