One of the #PandemicPositives has been the @healthdpt Coronavirus dashboard. An essential tool in public health especially with deniers about! We need more now wrt predicting admissions per trust. Gather senior mgmt teams know but were told not to share! Is this so @WestDan_?
2/n We get models cause anxiety in some circles but this is now different cc surge 1. Anything that helps both bed planning, a PH message reminder to maximise distancing (esp inside) & thus supports lockdown can stop this surge 2 on top of surge 3 lasting months not weeks.
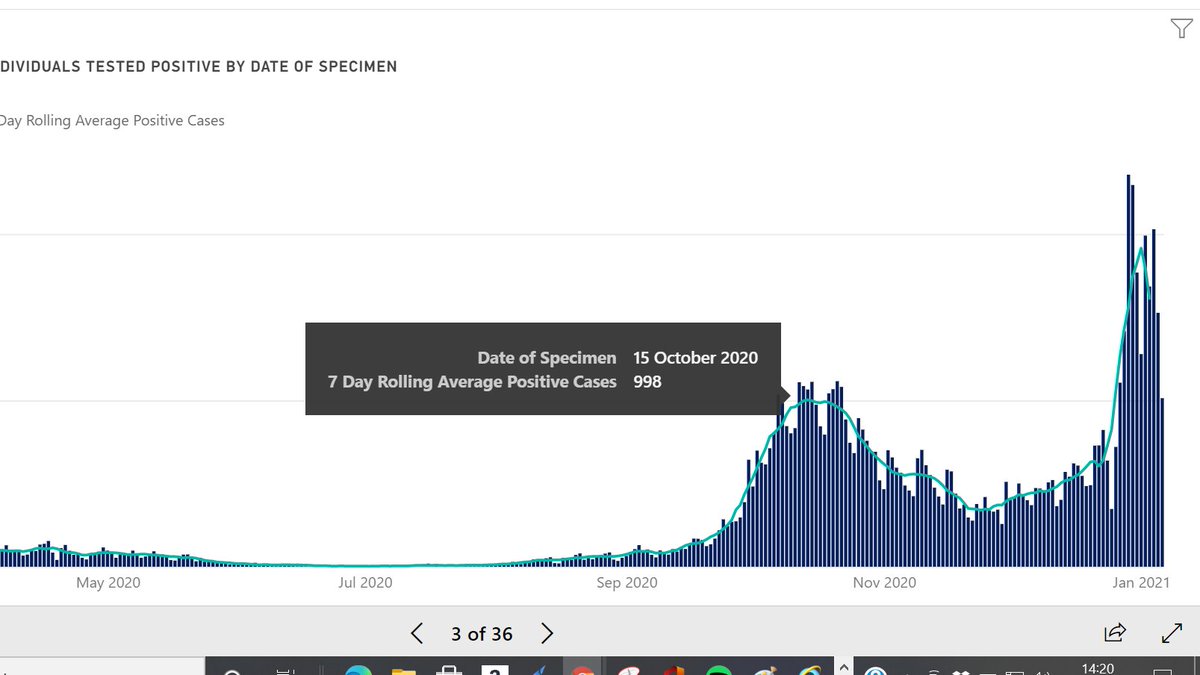
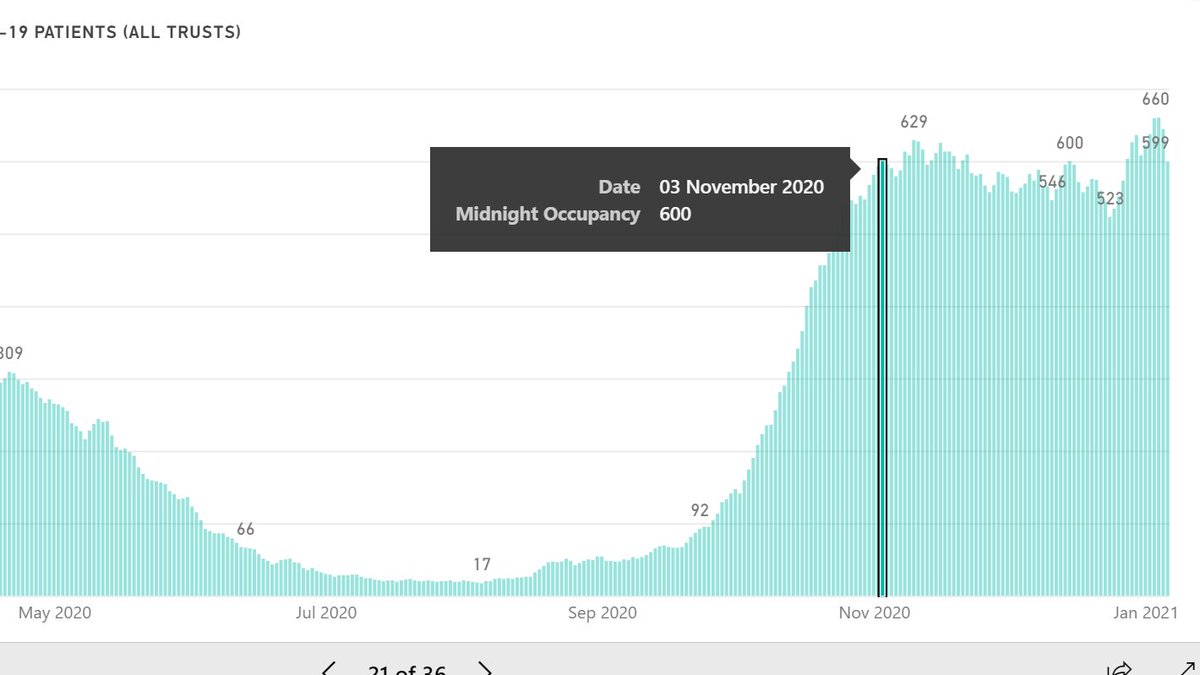
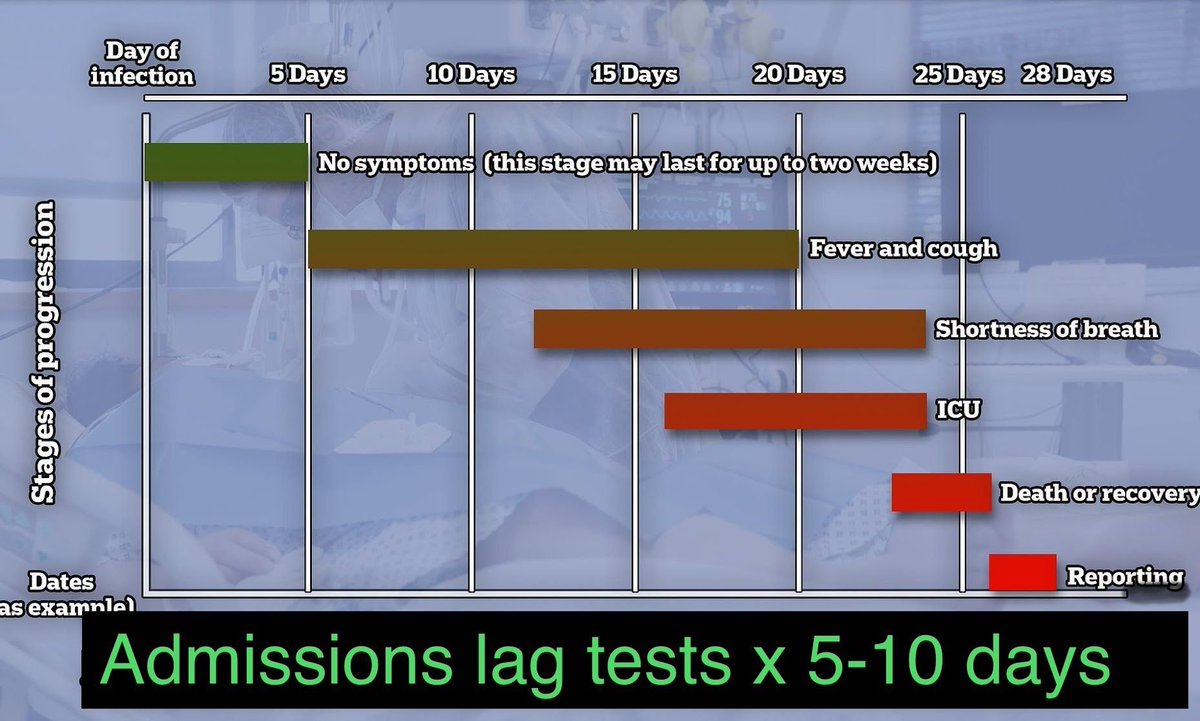
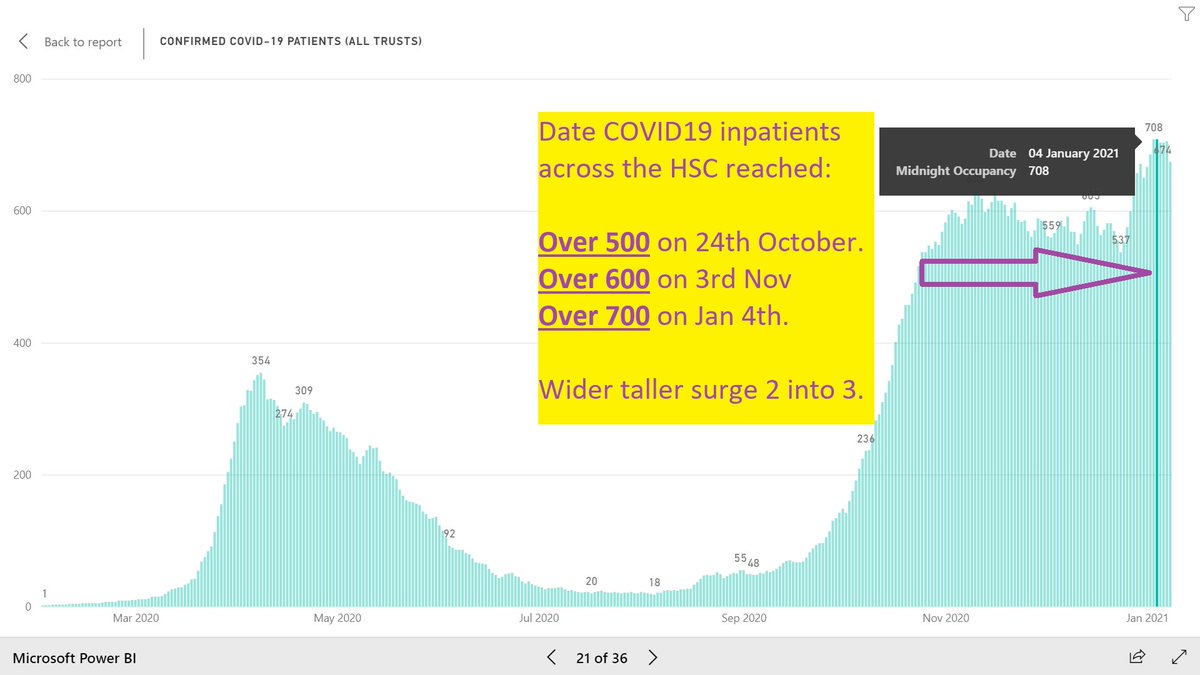
3/n Used the 2 dates above to highlight that at present my colleagues are using such crude approaches such that for daily incident cases of say ~1000 on 15th Oct, ~2 weeks later this 'translated' into ~600 inpatients 3rd Nov. 20% of all our beds. Of course this is crude....
4/n As inpatients depends on age of the incident cases, days of such cases and duration/severity of illness etc. So since we now have a rolling 7 day total of ~2000 incident cases per day we can perhaps wonder about 1000-1200 inpatients with Covid around the 15-20th Jan.
5/5 Others will debate my crude estimate but misses point that I'm better as a kidney doctor/CD with the estimates sitting there so I can help our dialysis staff estimate when's best to have time off! Peak dialysis seems to be 1-3 weeks after peak ICU but how would I know that?
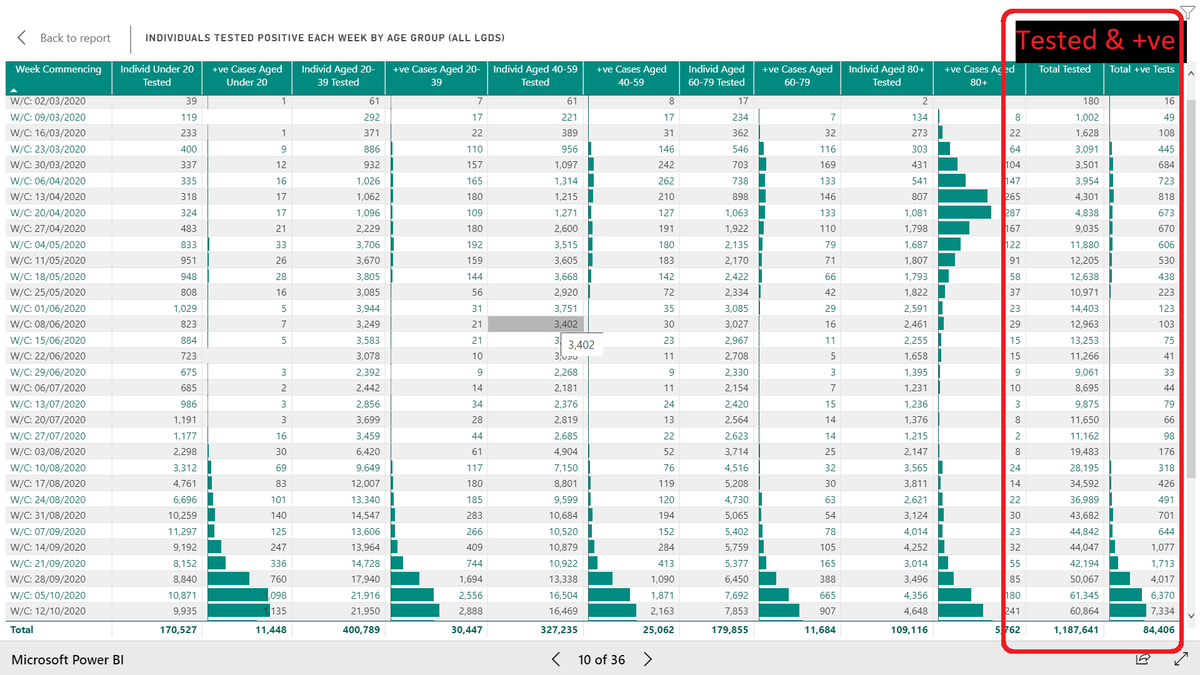
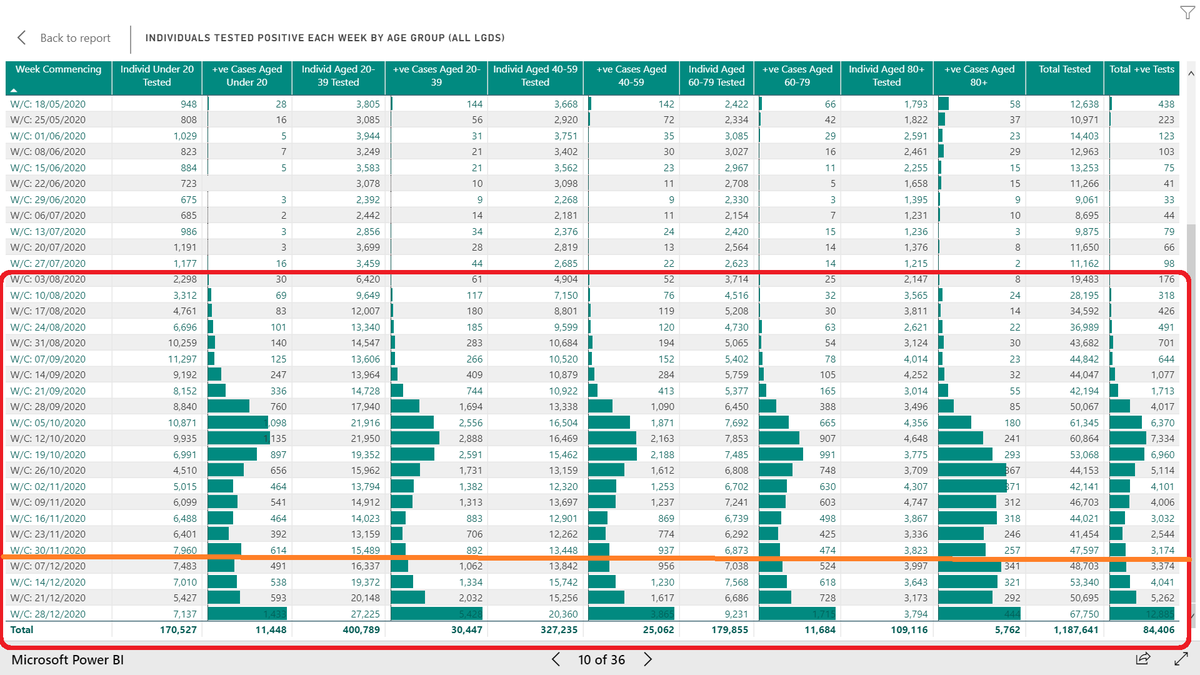
HSC covid thread 6/n: Further thoughts on what we face. As above illness severity rises with age driving admissions, ICU & deaths. We should look carefully at the +ve cases by age. First weekly +ve cases WB 2nd March-WB 10th October. Superb increased testing from labs.
7/n: Using the same table on the dashboard (pop's out into a new window via top right of each image) we can see the same data by each week with now a dramatic increase in +ve cases across all ages. December highlighted below the orange line. GPs are the first to see the impact.
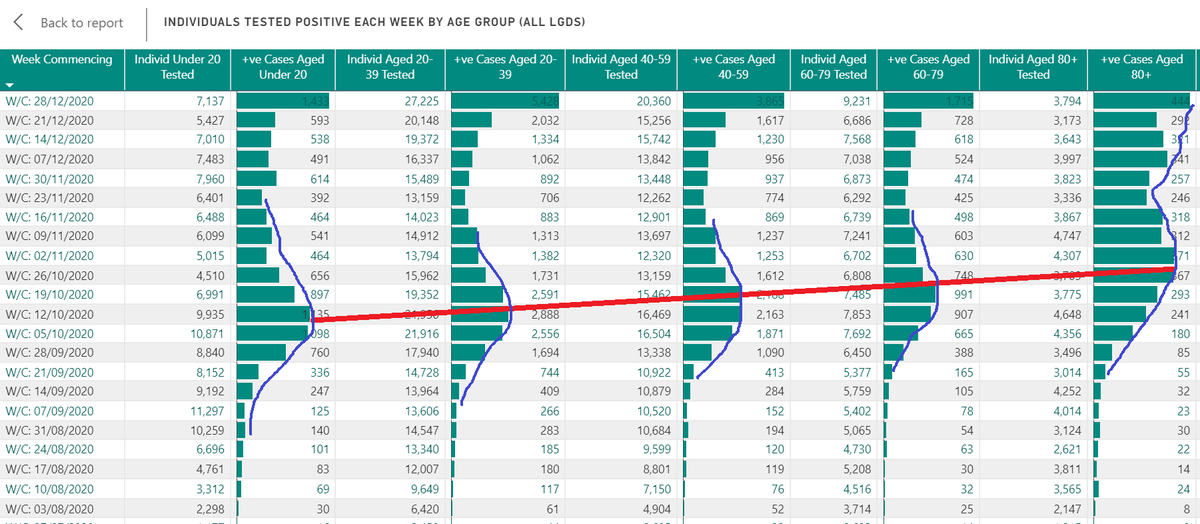
8/n: Sorting table so recent weeks top & added crude distributions of cases by age bracket. The younger +ve cases peak ~3 weeks earlier than oldest group. Although absolute numbers not to scale the older groups at right are why ED, respiratory & medical beds filling up.
9/n: So1-2 weeks after admissions ICU numbers rise. Most inpatients survive but it takes weeks & months to get better; nothing like a flu but more akin to major car accident where weeks of surgery & rehab needed. Even though other beds the impact on total bed days is massive.
10/10: So this is more Tsunami than wave/surge; taller & wider than the spring surge. Treatments only do so much. Can make a difference & take weeks off with most effective lockdown. End with a 1 minute video parallel from Indian Ocean Tsunami. #StayHome 


 Read on Twitter