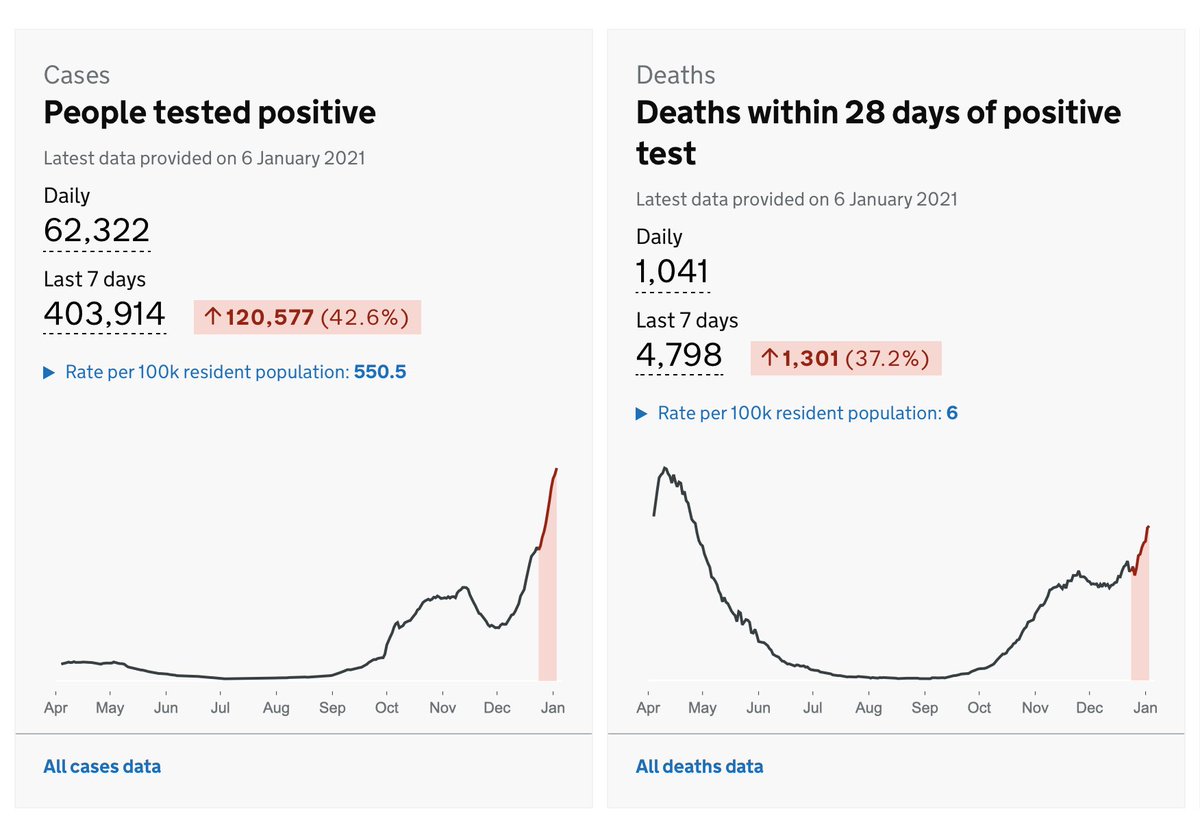
There will doubtless be lots of attention on this number tonight: 1k #COVID19 deaths for first time since last spring.
Now, a lot of people are dying, the number is mounting and this is clearly awful news.
BUT be cautious about this fig. It comes back to the bank holiday effect…
Now, a lot of people are dying, the number is mounting and this is clearly awful news.
BUT be cautious about this fig. It comes back to the bank holiday effect…
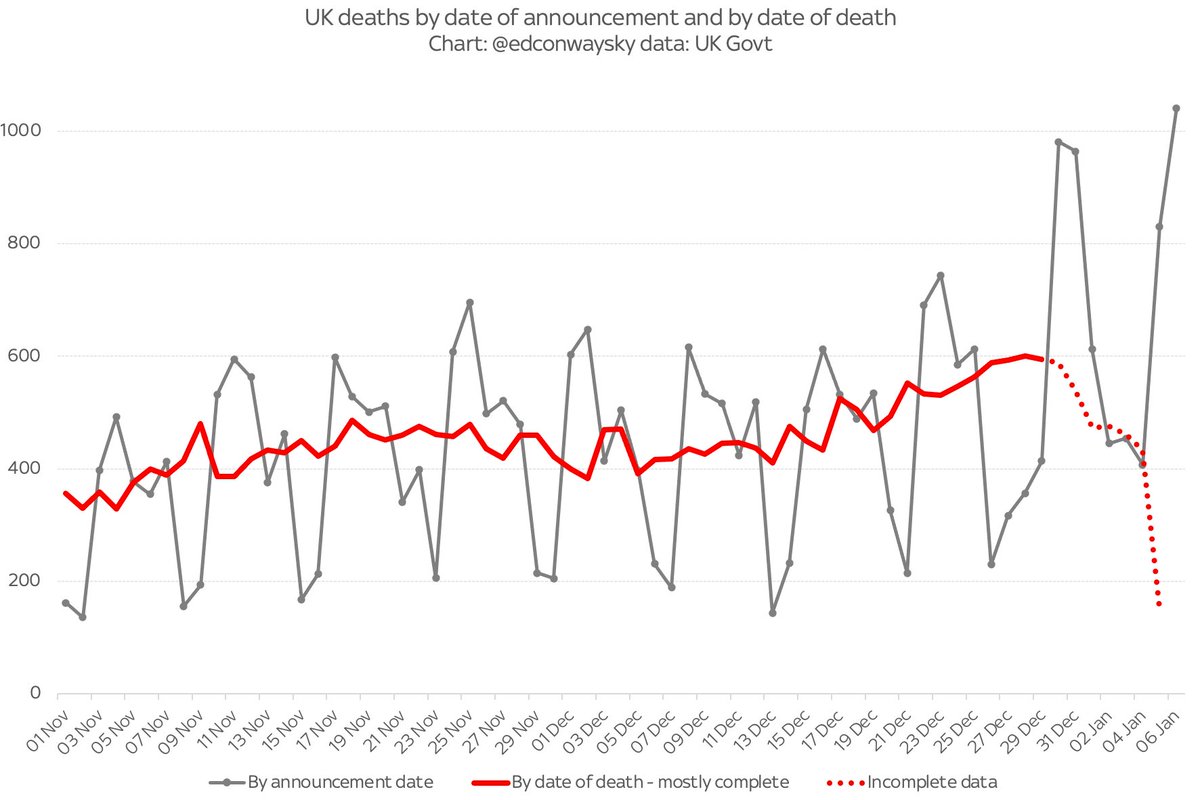
As I said yday, testing and deaths registration is affected by xmas and new year - and that’s happening with this data. The 1k deaths figure is not deaths happening in the past 24 hours but deaths REPORTED in that period. An important distinction when gauging #COVID19 spread
In the case of tonight’s 1k deaths figure, almost one in four of them happened more than a week ago: there’s a big backlog of registrations which are only now being processed. The real picture is the red line in this chart. Not the grey line (where that 1k fig comes from)
The underlying picture is that #COVID19 deaths are mounting at a far more gradual but also far more sustained rate than we saw in the spring. This is clearly not cause for celebration, but is somewhat different from the skyrocketing phenomenon one might take from the headline fig
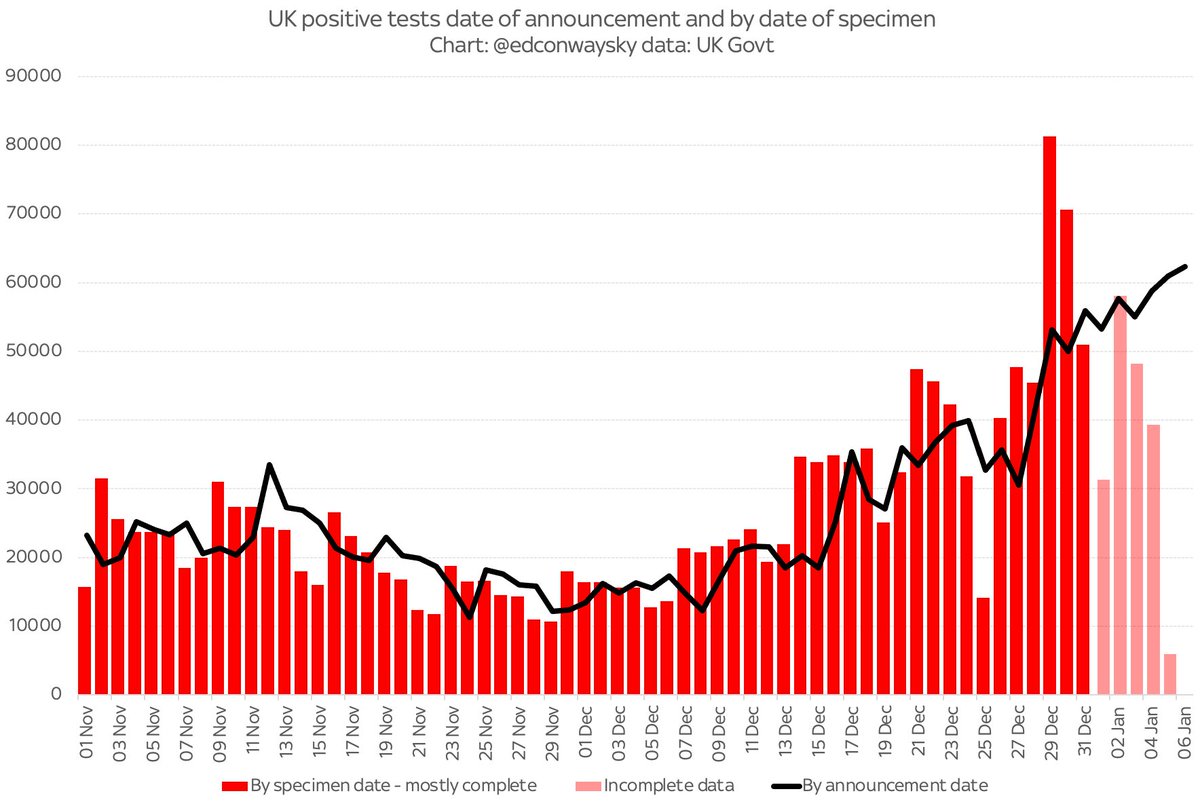
Ironically when it comes to the testing data the daily reported figures (black line) might currently be giving a somewhat better indication of the spread of #COVID19 than the numbers by specimen date (red bars). See that big jump on Dec 29 and 30? Bank holiday effect again...

 Read on Twitter


