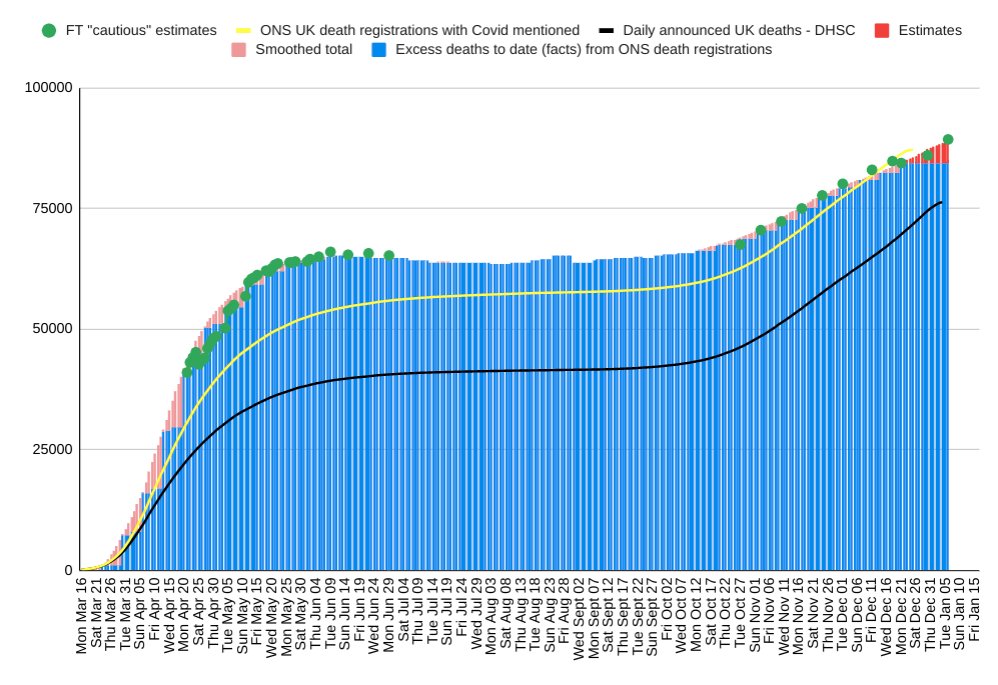
UPDATE: following the latest ONS figures, my best estimate of the number of excess UK deaths linked to Covid-19 since mid-March is
89,300
The increase in the second wave has been slower, but longer and more relentless than the first wave
1/
89,300
The increase in the second wave has been slower, but longer and more relentless than the first wave
1/
The estimates this week are more speculative than normal because
a) Scotland and Northern Ireland have not published weekly mortality figures since before Christmas
b) England and Wales data had one bank holiday rather than 2 for this week in the year
This means...
2/
a) Scotland and Northern Ireland have not published weekly mortality figures since before Christmas
b) England and Wales data had one bank holiday rather than 2 for this week in the year
This means...
2/
If I had used the raw ONS figures, (3,566 excess deaths E&W) it would have produced estimates too high and obviously wrong.
So I had to make adjustments, which I hope were reasonable to keep the trend stable. We will find out next week.
3/ https://twitter.com/ONS/status/1346752007131029505
So I had to make adjustments, which I hope were reasonable to keep the trend stable. We will find out next week.
3/ https://twitter.com/ONS/status/1346752007131029505
It's better to make arbitrary adjustments to a model than keep it consistent but obviously wrong (I think, but neither is optimal)
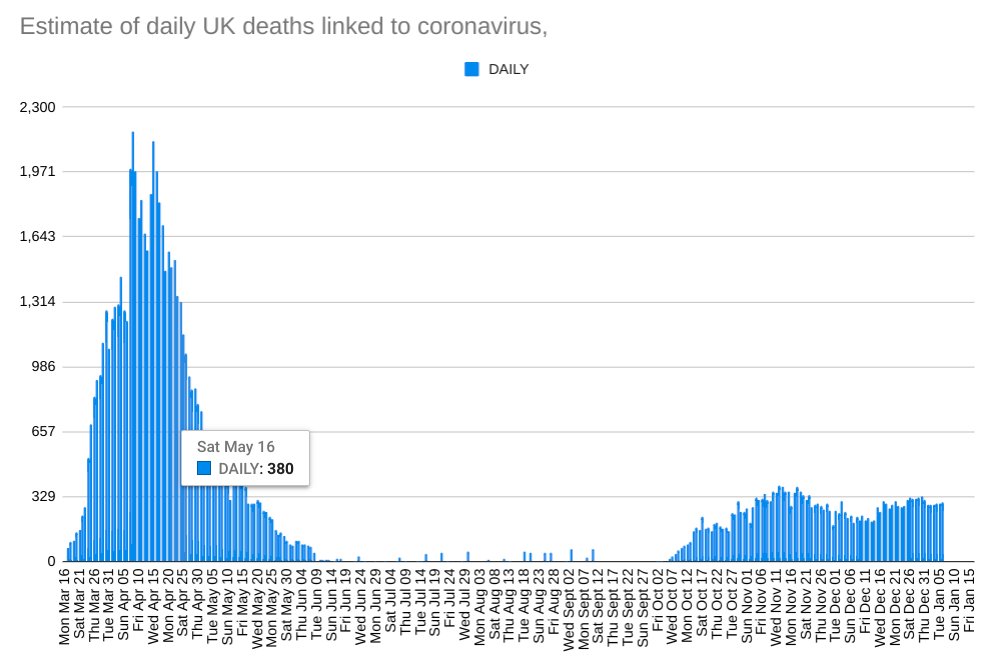
The daily pattern shows excess deaths running about 300 a day - this is not flu - or OK - or nothing to worry about
4/
The daily pattern shows excess deaths running about 300 a day - this is not flu - or OK - or nothing to worry about
4/
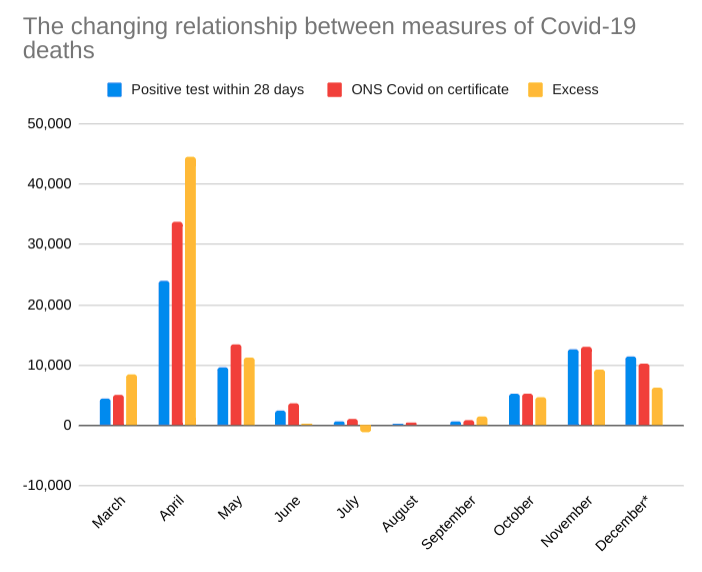
But the better news is that excess deaths are lower than deaths recorded within 28 days of a positive test.
It implies that in the spring, those dying of Covid were not tested. Now some of those dying of Covid would have died anyway in all probability (but far from all)
5/
It implies that in the spring, those dying of Covid were not tested. Now some of those dying of Covid would have died anyway in all probability (but far from all)
5/
Most of the Covid data is pretty bleak at the moment for obvious reasons. Excess deaths is one small silver lining.
There are a few others, which I will tweet about later with a new FT article
ENDS
There are a few others, which I will tweet about later with a new FT article
ENDS

 Read on Twitter


