ok, so pulled some data this morning ... https://twitter.com/Claudia_Sahm/status/1345922009641975808
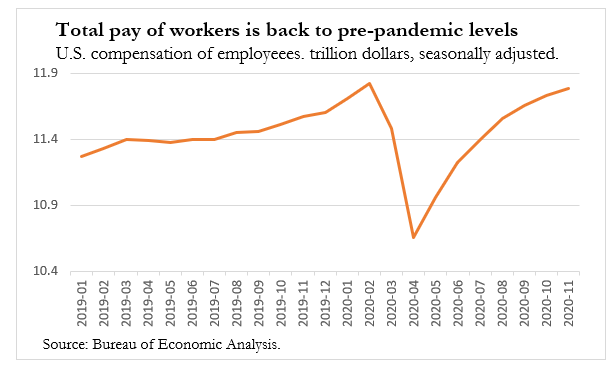
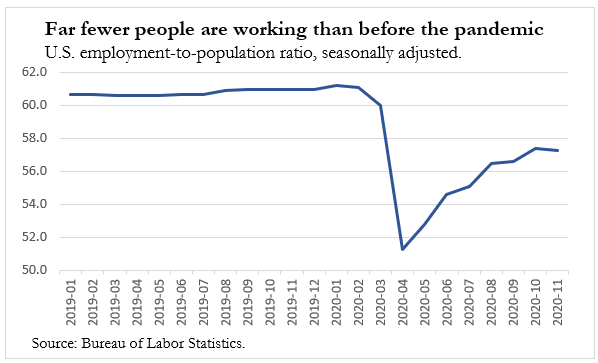
what set off my sleuthing was @TimDuy highlighting (as others have) that total compensation to employees in US is pretty much back to pre-pandemic levels. yup. (my chart left). BUT we have about 10 million fewer people working. (my chart right). so were they making any money??
well, not really.
1st chart on compensation adds up ALL workers in the country. a chief executive at Amazon adds **a lot*** more to the total than an employee at local retailer who lost their job as we bought more from Amazon.
inequality's NOT new. @BEA_News's got new data.
1st chart on compensation adds up ALL workers in the country. a chief executive at Amazon adds **a lot*** more to the total than an employee at local retailer who lost their job as we bought more from Amazon.
inequality's NOT new. @BEA_News's got new data.
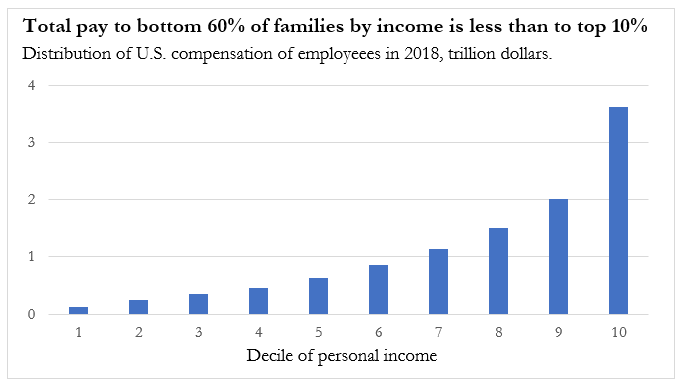
this spring @BEA_News published its estimates of how their national totals for personal income are split across families by income. we https://www.bea.gov/data/special-topics/distribution-of-personal-income. latest numbers from 2018, but the data say a lot about where we were before the bottom fell out.
gotta admit that even I -- as someone who has stared at
BEA totals AND thought hard about inequality for years -- was taken aback at how little people at the bottom 'matter' for the national totals.
BEA totals AND thought hard about inequality for years -- was taken aback at how little people at the bottom 'matter' for the national totals.
pressing question of the day is: what data are you going to use to say mission accomplished in this recovery? I have seen the recovery in total personal income and compensation bandied about as a sign that we have 'done enough' and in some cases 'done too much' (jfc)
personally, I take the full employment mandate to heart that's part of the Fed's mandate. but sadly even they don't have a specific definition or a numerical goal for it. on the other hand, we got a lot of the aggregate data.
props to @BEA_News for developing new series to unpack the inequality underneath the national data. **THE** expert on these new data is @MGindelsky. see her webpage https://sites.google.com/view/mgindelsky/research for more details. highly recommend the web appendix!
again, here's the official webpage for these new data. it would be amazing to see them published alongside the national release every month. would help us better understand what's going on, not trying to guess what's going on under the hood. https://www.bea.gov/data/special-topics/distribution-of-personal-income
while I applaud the many efforts by academics and private companies to use private Big data to look at how the pandemic is affecting different families, it's REALLY important to be able to link it back to traditional macro data. no one can do that math in their head. it matters.
one last story then I better get back to doing work ... when I was a senior economist at Obama @WhiteHouseCEA I was asked to calculate the 'GDP effects' of a proposal that would help some lower-income borrowers. my quick retort was it won't. and why is that the metric?

 Read on Twitter


