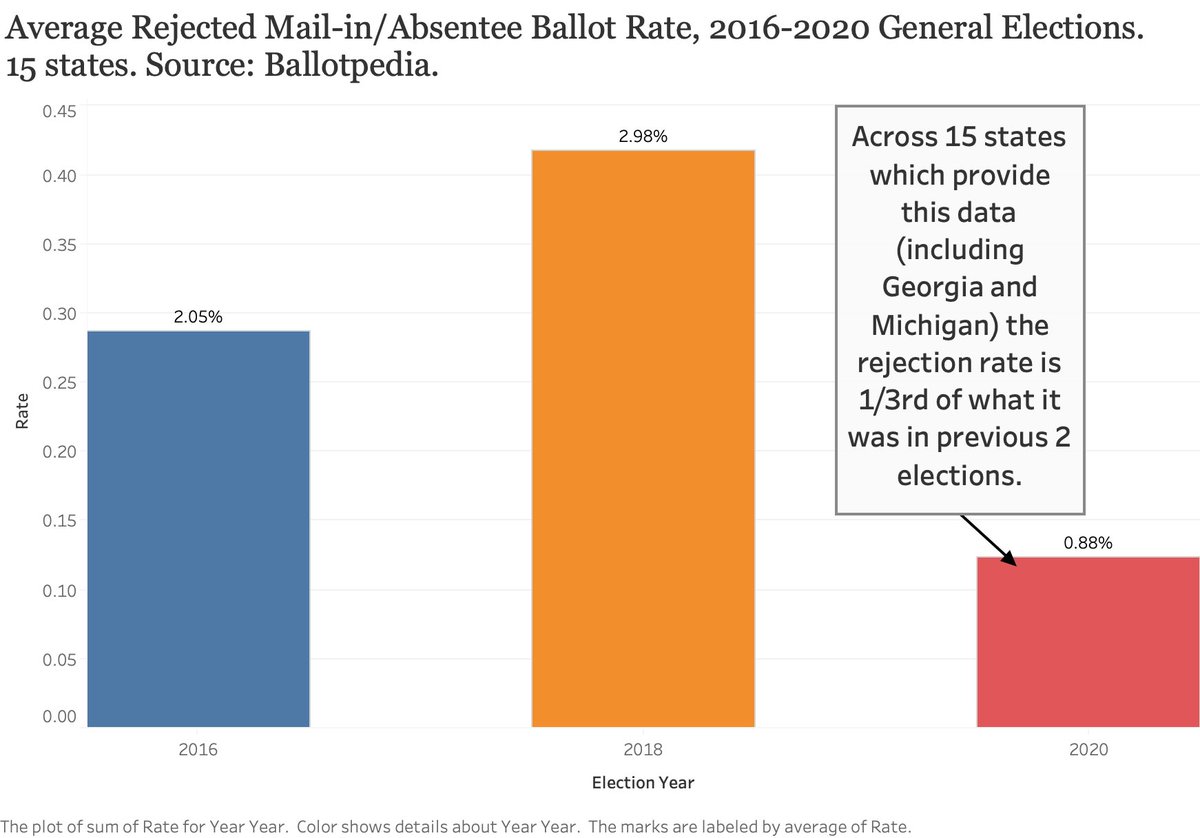
Consider this chart. There are 15 states which have provided official rejection rates for their mail-in and absentee ballots. Results? in 2016 2% of ballots were rejected. This year less than 1%.
How do rejection rates fall by 2/3rds while absentee ballots increase 10-fold?!
1/
How do rejection rates fall by 2/3rds while absentee ballots increase 10-fold?!
1/
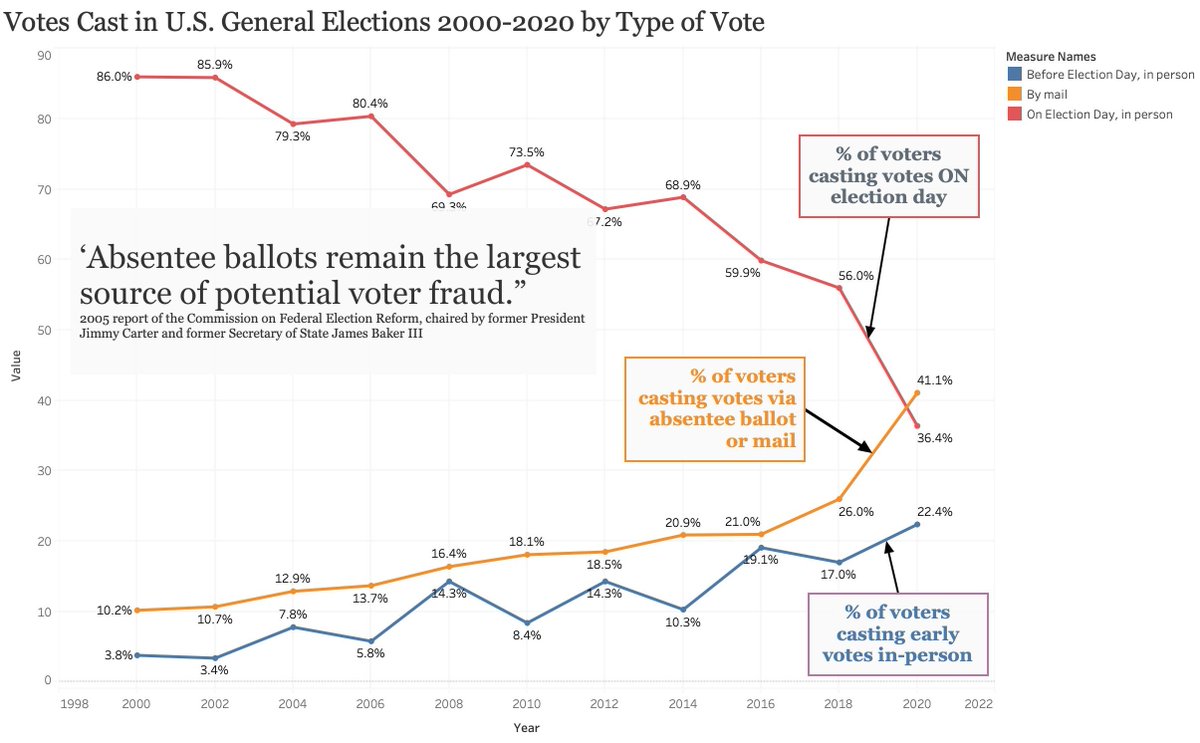
You recall last week we published two other important charts: the set-up to an election fraught with ineptitude, law-breaking, and straight up fraud. First, the massive jump in mail-in and absentee ballot requests vs. in-person voting.
2/
2/

 Read on Twitter


