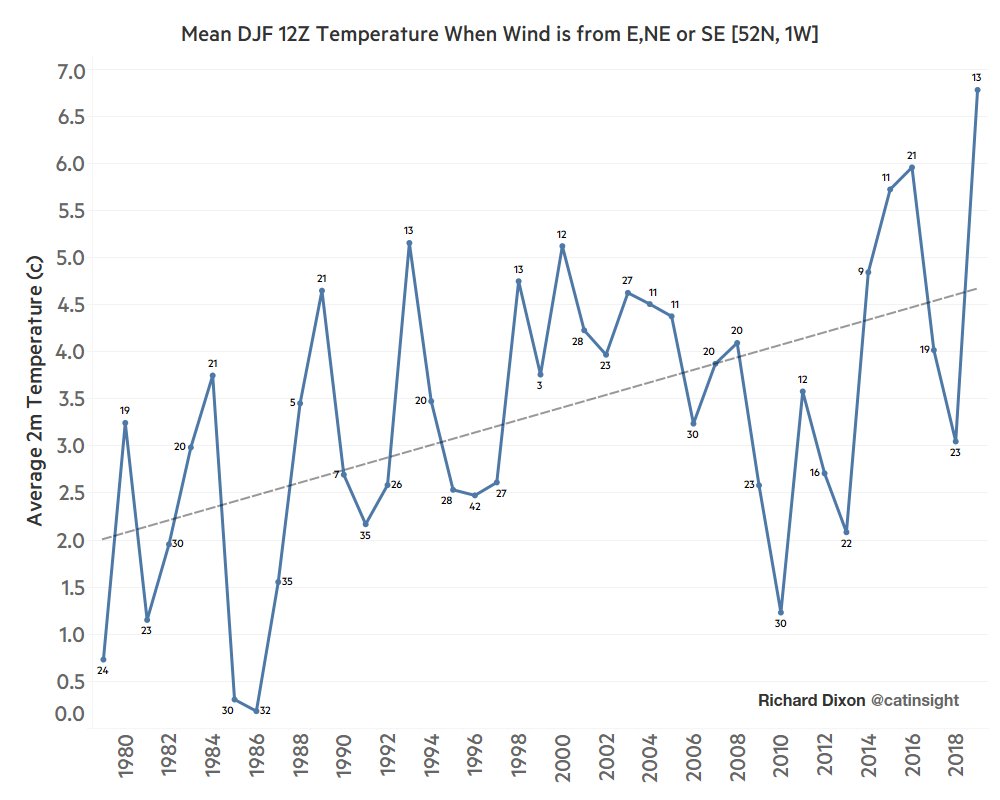
If you live in SE England & are saddened by lack of snow in this easterly, turn away now. This shows the mean 12Z temperature for a SE/E/NE wind from 1979-2019 from ERA5 data for 52N, 1W. 2c of warming in easterlies since late 70s (small numbers are count of occurrence/year).
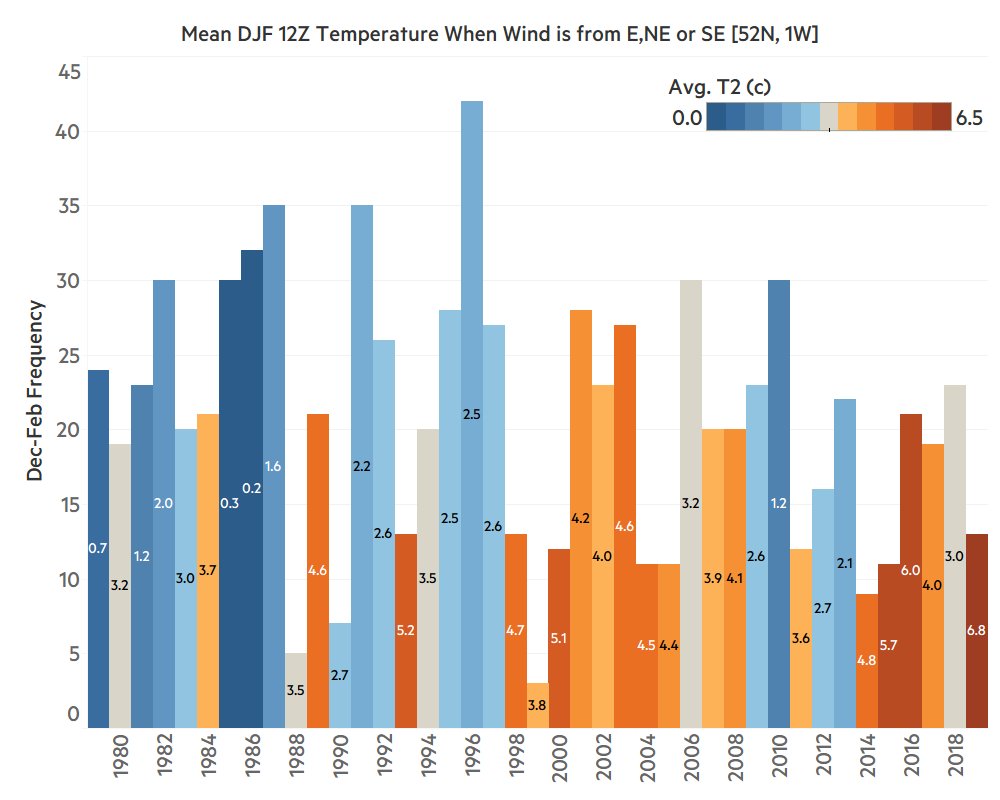
There was a request yesterday for clarity on frequency of easterlies so here's the same data expressed with height of bar as frequency of E'ly by year with 'warming stripes' for mean temperature of the E'ly. Suggestive of "fewer easterlies and warmer when they do happen".
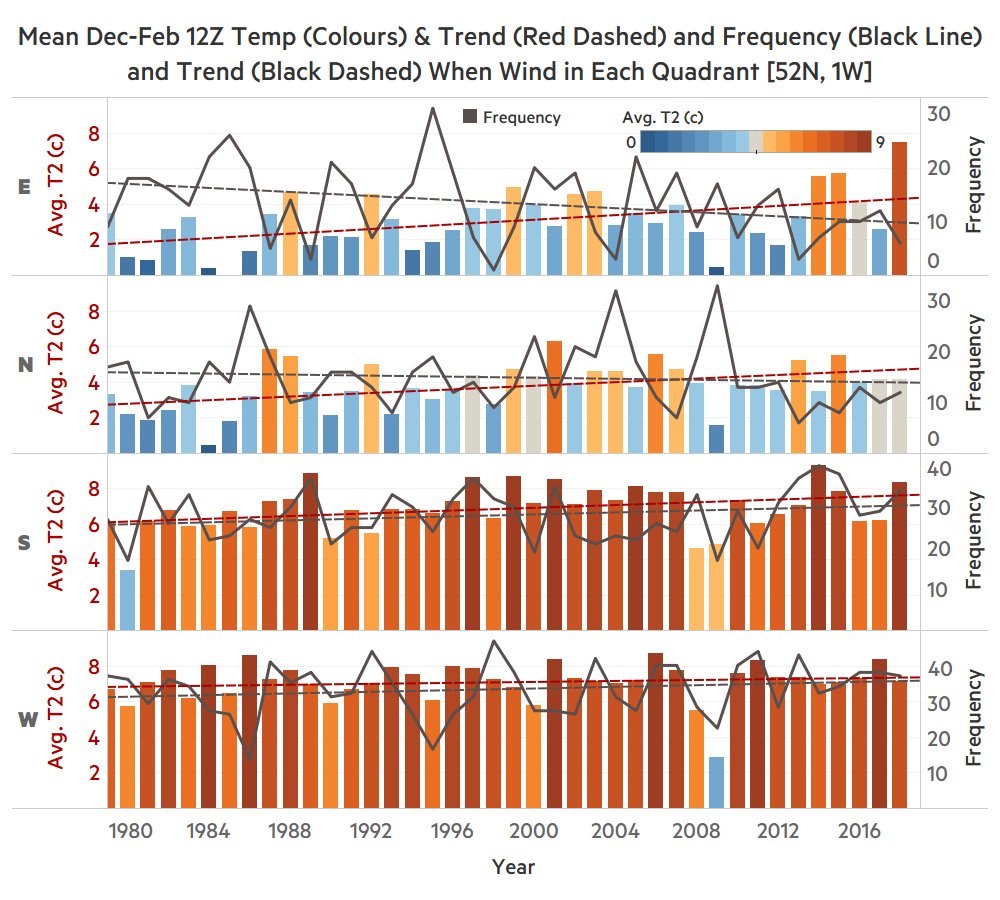
Here's one final chart: I've split the compass into 90 degree quadrants to show change in 12Z temperature and frequency of wind for DJF in the ERA5. Suggestive of E'lies and N'lies becoming less frequent and warming more than S'lies and W'lies.

 Read on Twitter


