How to analyze visitor's engagement by using these 7 important Google Analytics Reports?
[thread]
[thread]

Why do you need Google Analytics in the first place?
Think of it as a journal that you keep for your in-person meetings to record human interaction, feedback.
Every customer visit is a unique interaction and GA keeps notes
Think of it as a journal that you keep for your in-person meetings to record human interaction, feedback.
Every customer visit is a unique interaction and GA keeps notes
Report [1/7]: Source/medium report.
Go to Acquisition > All Traffic > Source/Medium in the left navigation. This report appears
Go to Acquisition > All Traffic > Source/Medium in the left navigation. This report appears
In each report- focus on the story.
In acquisition report, Bounce rate is higher for CPC than Google organic -> looks like our organic keywords are bringing more targeted traffic than paid ones.
The session time also validates this.
Next step -> investigate paid keywords
In acquisition report, Bounce rate is higher for CPC than Google organic -> looks like our organic keywords are bringing more targeted traffic than paid ones.
The session time also validates this.
Next step -> investigate paid keywords
If your report doesn’t look like mine, that’s because I’m using UTMs. check out my blog for more info on UTMs https://bit.ly/3odTB49
UTM helps you to identify traffic from each campaign/source etc.
UTM helps you to identify traffic from each campaign/source etc.
Report [2/7]: Visitor engagement by landing page in Google Analytics
go to Behavior > Site Content > Landing Pages.
go to Behavior > Site Content > Landing Pages.
This one highlights a problem.
Site doesn't have a landing page other than homepage.
This creates issue with user onboarding.
The users directly landed on tools pages without knowing what to expect (because of no landing page)
Result -> high bounce rates
Site doesn't have a landing page other than homepage.
This creates issue with user onboarding.
The users directly landed on tools pages without knowing what to expect (because of no landing page)
Result -> high bounce rates
Report [3/7]: Device Overview Report
go to Audience > Mobile > Overview
go to Audience > Mobile > Overview
What this report tells us about device behavior?
Bounce rate in mobile and tablet are much higher compared to desktop
Pages per session are also lower.
Mobile users are having a difficult time
We need to work on the responsiveness
Bounce rate in mobile and tablet are much higher compared to desktop
Pages per session are also lower.
Mobile users are having a difficult time
We need to work on the responsiveness
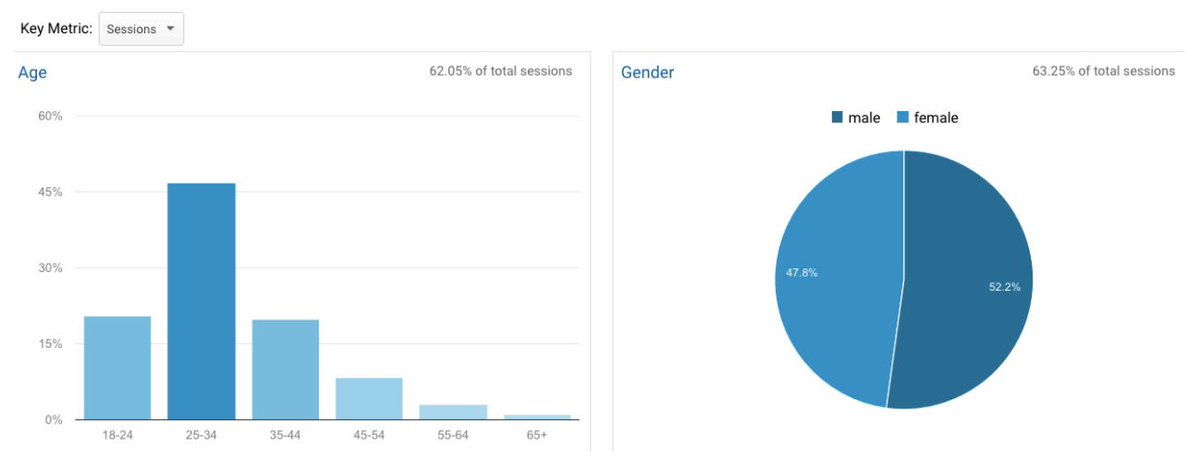
Report [4/7]: Audience Overview Report
go to Audience > Demographics > Overview
go to Audience > Demographics > Overview
This report is not generated by default (see https://bit.ly/3obsMOf ) but provides great insights on user demographics.
What are the major groups of
 Gender
 Age group
By knowing this you can customize landing pages for each segment
It can also be helpful for ad targeting
What are the major groups of
 Gender
 Age group
By knowing this you can customize landing pages for each segment
It can also be helpful for ad targeting
Report [5/7]: Audience Interests Report
Go to Audience -> Interests -> Overview
Go to Audience -> Interests -> Overview
This report also needs to be set up. (see https://bit.ly/3obsMOf )
It tells you about the major:
 Affinity categories
 Market segments
This report together with demographics can help you create user personas for your user segments and target them with appropriate messaging.
It tells you about the major:
 Affinity categories
 Market segments
This report together with demographics can help you create user personas for your user segments and target them with appropriate messaging.
Report [6/7]: Audience Overview Report (default report)
Go to Audience -> Overview
Additional step: add segment -> Returning users
you can add lots of available segments here and compare the average with these categories
Go to Audience -> Overview
Additional step: add segment -> Returning users
you can add lots of available segments here and compare the average with these categories
How your returning users behave relative to average users.
In this example, 15% of all users are returning- they account for 50% sessions and 80% page views.
By knowing their behavior, understanding what's working for them, we can double down on things that brings them back.
In this example, 15% of all users are returning- they account for 50% sessions and 80% page views.
By knowing their behavior, understanding what's working for them, we can double down on things that brings them back.
Report [7/7]: Behavior Flow Report (default report)
Go to Behavior-> Behavior Flow
Go to Behavior-> Behavior Flow
How users navigate the site?
You can click on any box -> select Highlight traffic through here
If you have landing pages and pricing page it gives us quick overview on % people going to pricing from each landing page and other such flows.
This helps us create useful funnels.
You can click on any box -> select Highlight traffic through here
If you have landing pages and pricing page it gives us quick overview on % people going to pricing from each landing page and other such flows.
This helps us create useful funnels.
Also a good thread for anyone in #MarketingTwitter who is trying different digital marketing channels

 Read on Twitter
![Report [1/7]: Source/medium report. Go to Acquisition > All Traffic > Source/Medium in the left navigation. This report appears Report [1/7]: Source/medium report. Go to Acquisition > All Traffic > Source/Medium in the left navigation. This report appears](https://pbs.twimg.com/media/Eq21G-XXcAEvS3D.png)


