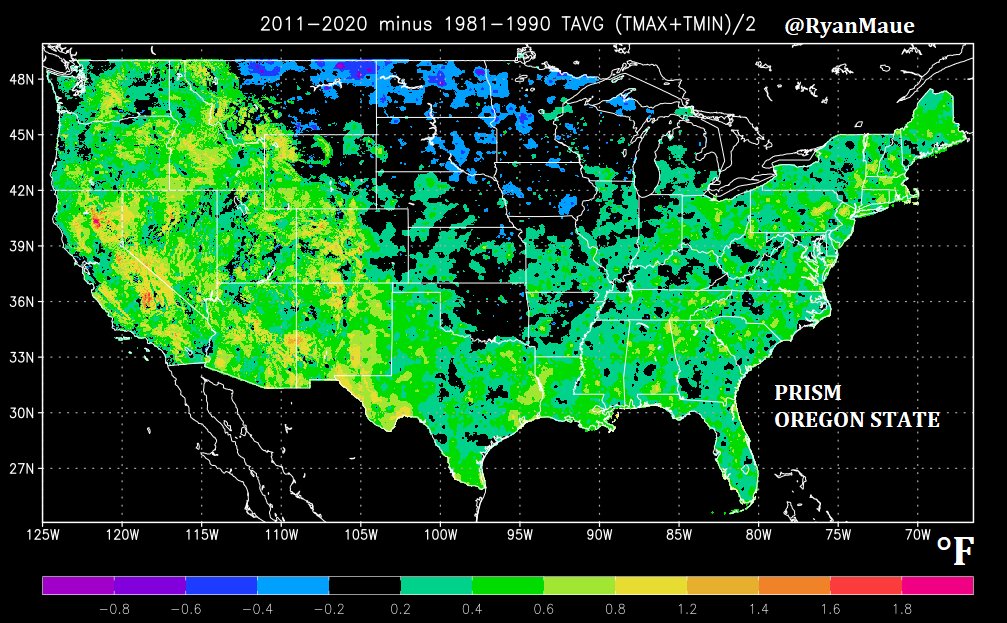
Prelim temperature data has arrived to complete 2020 & put a lid on the most recent "climate decade" across the U.S.
I quickly mapped up 2011-2020 minus 1981-1990 change in mean (daily) temperature.
Lower 48 change in "normals"
ΔTAVG = +0.32°F
ΔTMIN = +0.46°F
ΔTMAX= +0.18°F
I quickly mapped up 2011-2020 minus 1981-1990 change in mean (daily) temperature.
Lower 48 change in "normals"
ΔTAVG = +0.32°F
ΔTMIN = +0.46°F
ΔTMAX= +0.18°F
This calculation is simply the 30-year change in U.S. temperatures.
Quick thoughts:
Urban low temperatures are increasing dramatically
Overall U.S. high temperatures, not so much, but again, urban dominated.
b/c people live in cities, land-use change = local climate change
Quick thoughts:
Urban low temperatures are increasing dramatically
Overall U.S. high temperatures, not so much, but again, urban dominated.
b/c people live in cities, land-use change = local climate change
What to do?
Global / U.S. / regional / local temperature (climate) changes must always be population weighted just like how energy industry operates.
I see this in weather + load forecasting.
This is especially relevant for people & thermal comfort (cooling) in urban areas.
Global / U.S. / regional / local temperature (climate) changes must always be population weighted just like how energy industry operates.
I see this in weather + load forecasting.
This is especially relevant for people & thermal comfort (cooling) in urban areas.
I used PRISM data from Oregon State.
https://prism.oregonstate.edu/
But, another option for comparison is GRIDMET from @climate_guy
http://www.climatologylab.org/gridmet.html
https://prism.oregonstate.edu/
But, another option for comparison is GRIDMET from @climate_guy
http://www.climatologylab.org/gridmet.html
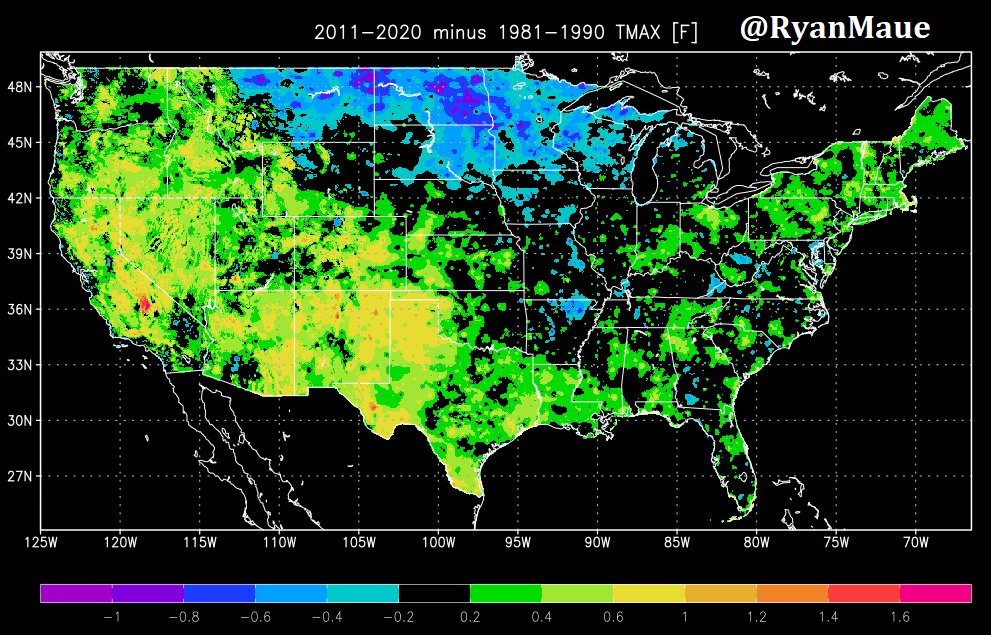
Per request: change in Maximum Temperatures (daily) averaged up across the 2 different decades.
Notable changes
Midwest U.S. -- cooling
Western U.S. -- warming
Physical climate reasons are not apparent b/c these time-slices need context.
Notable changes
Midwest U.S. -- cooling
Western U.S. -- warming
Physical climate reasons are not apparent b/c these time-slices need context.

 Read on Twitter


