1\\ Twelve years of unstoppable bitcoin transactions
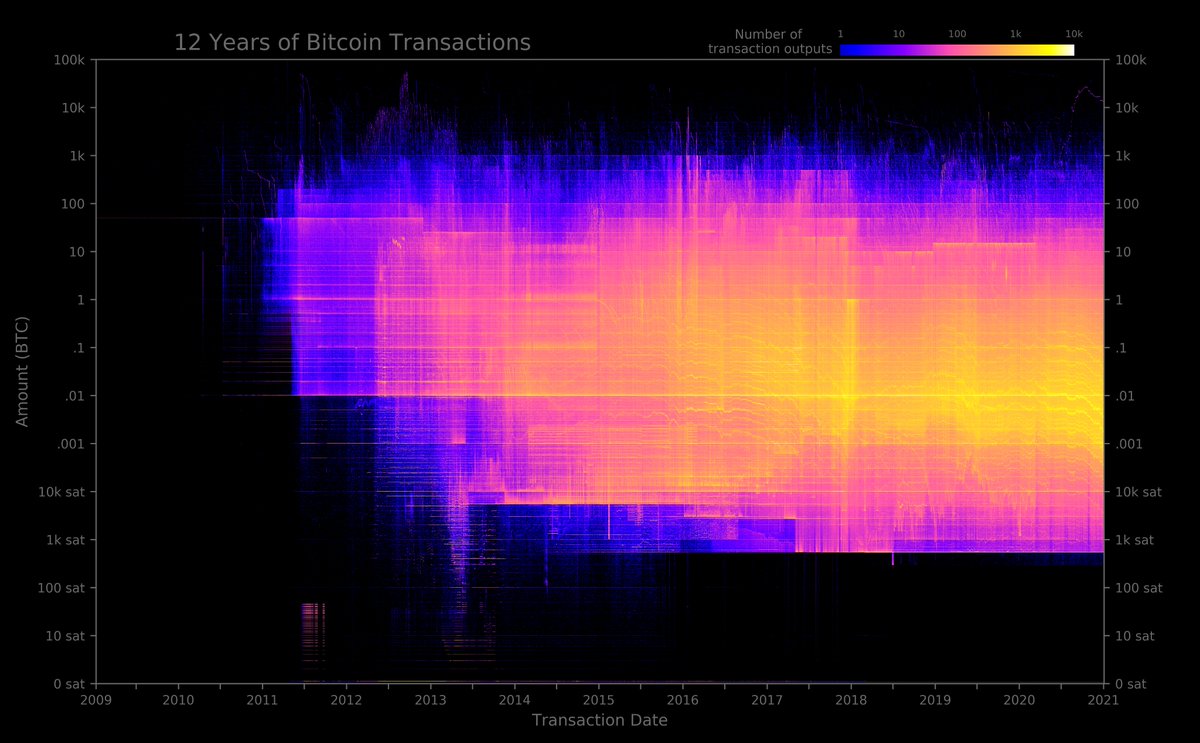
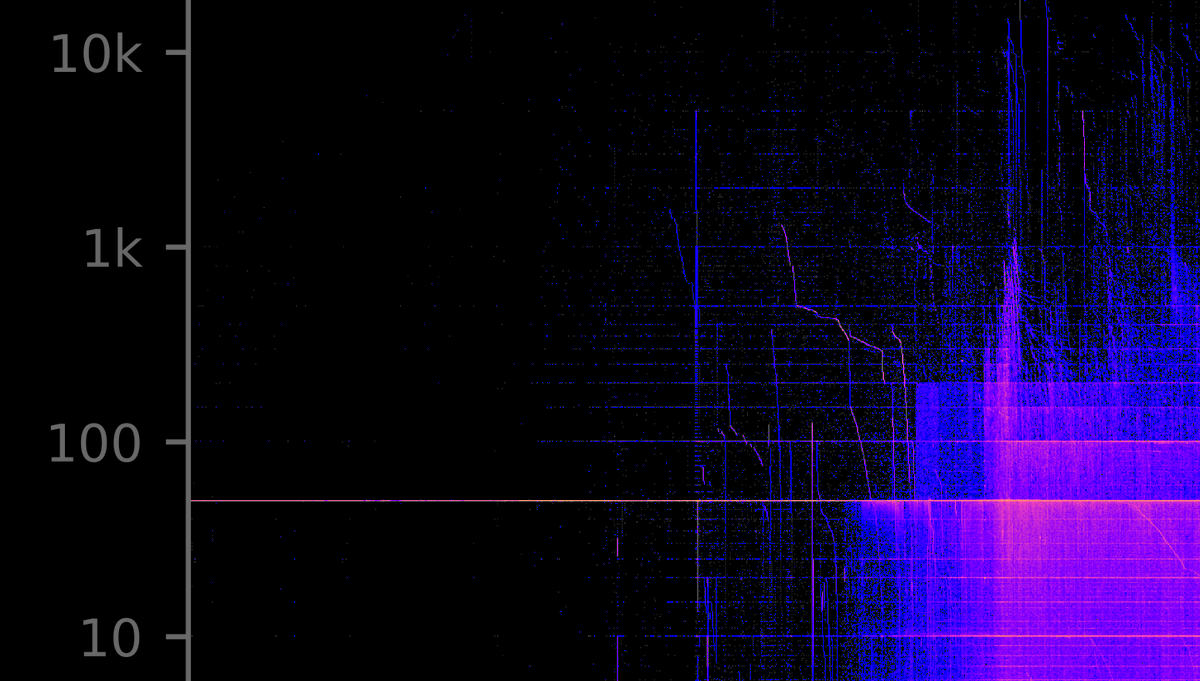
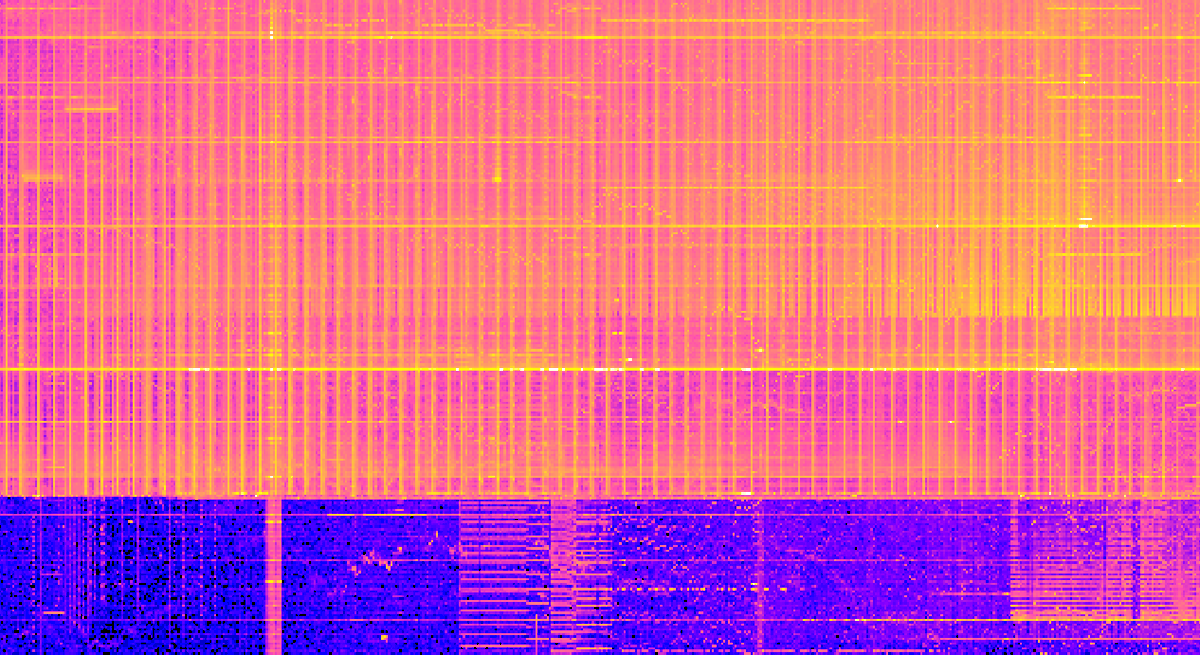
This heat map shows the ~1.6 Billion transaction outputs that occurred from 3-Jan-2009 to 3-Jan-2021
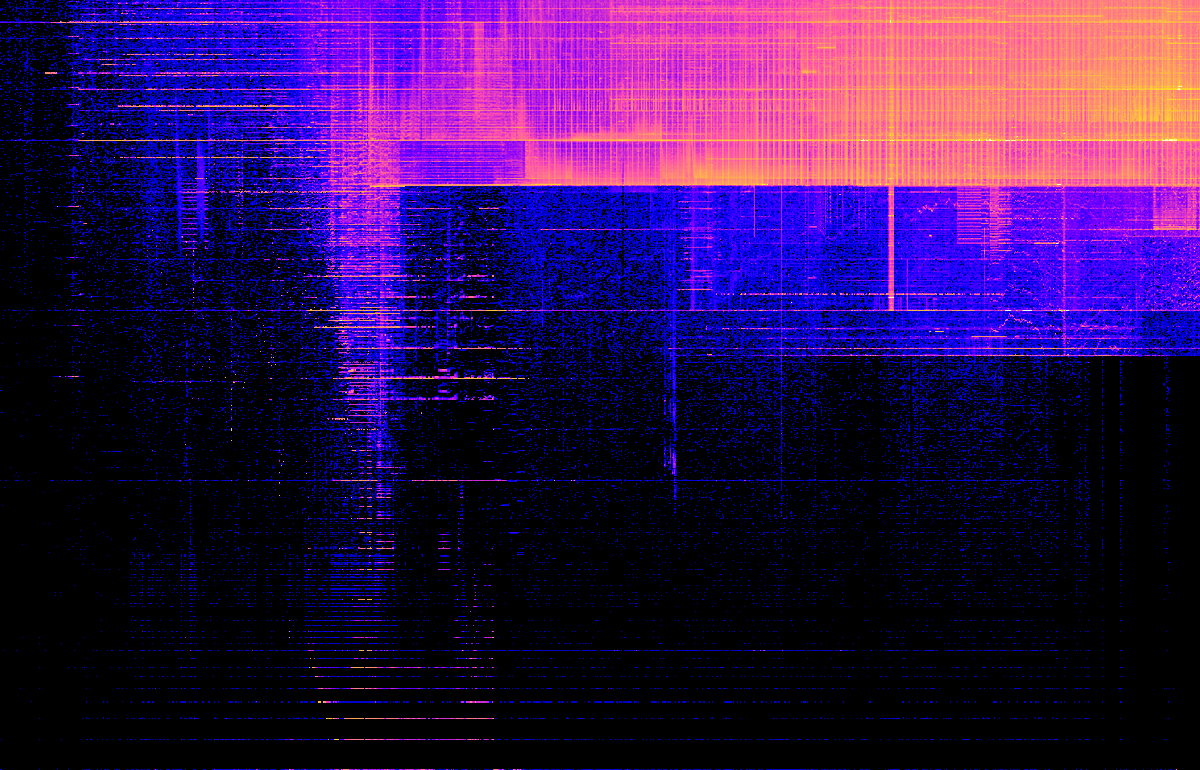
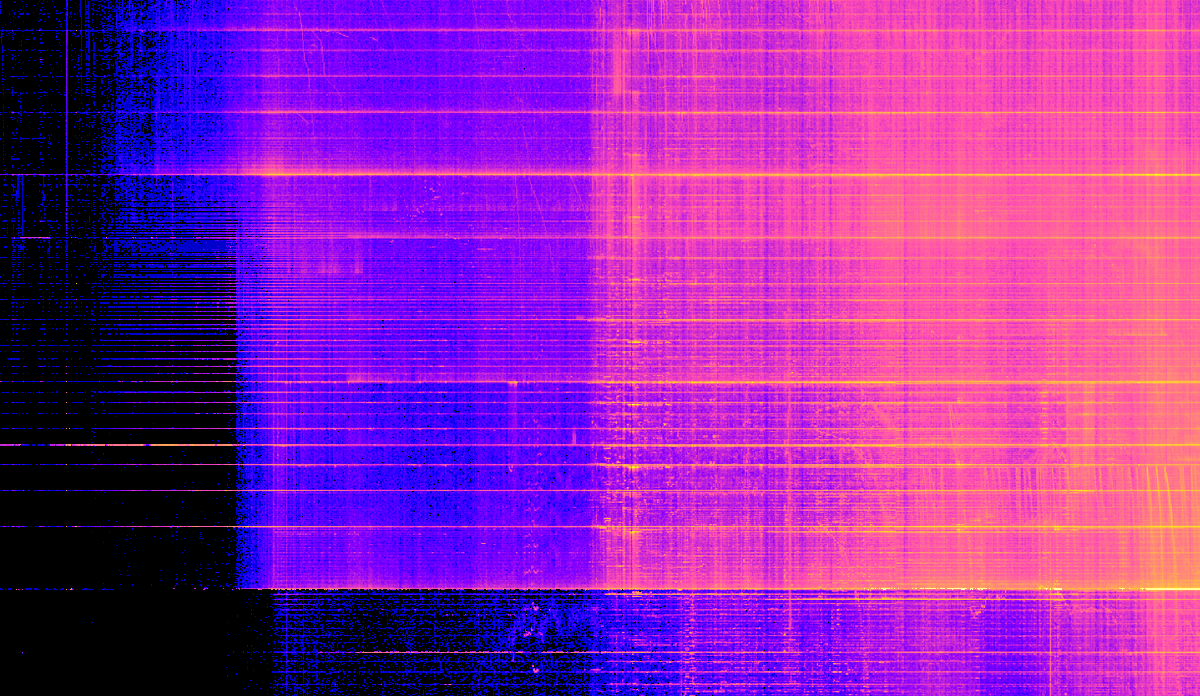
I've zoomed in on sections of interest below
This heat map shows the ~1.6 Billion transaction outputs that occurred from 3-Jan-2009 to 3-Jan-2021
I've zoomed in on sections of interest below

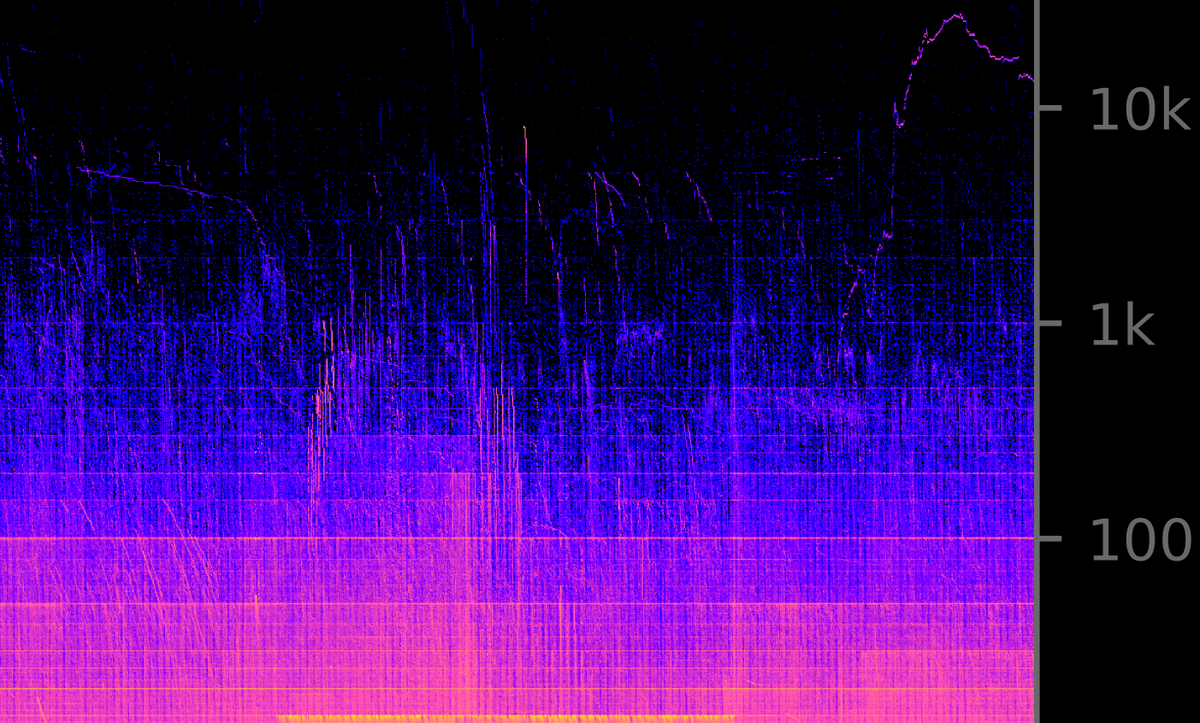
3\\ Horizontal streaks occur because we like to send each other round amounts of bitcoin (the most common is 0.01 btc)
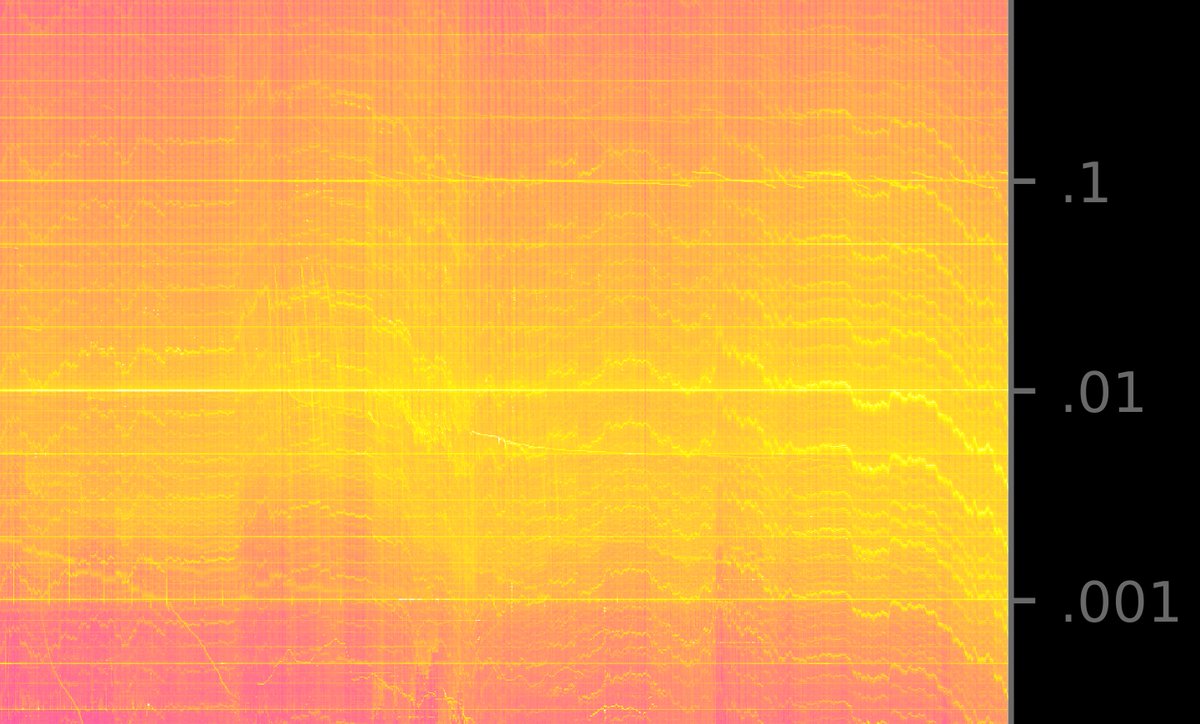
4\\ Because we also prefer to send round amounts of USD, the *inverse* USD price of bitcoin stands out in concurrent traces
The most common amount is $100 (currently ~0.003 BTC) though all round amounts, $1, $5, $20, $1000, etc show up
The most common amount is $100 (currently ~0.003 BTC) though all round amounts, $1, $5, $20, $1000, etc show up
5\\ Satoshi's 50 btc mining rewards in 2009 (visibly more near 100 bc of the log scale) then significant dispersion of coins starting in 2011
7\\ In August 2020 someone began sending ~20k btc transactions (currently ~$600M) hundreds of times every day
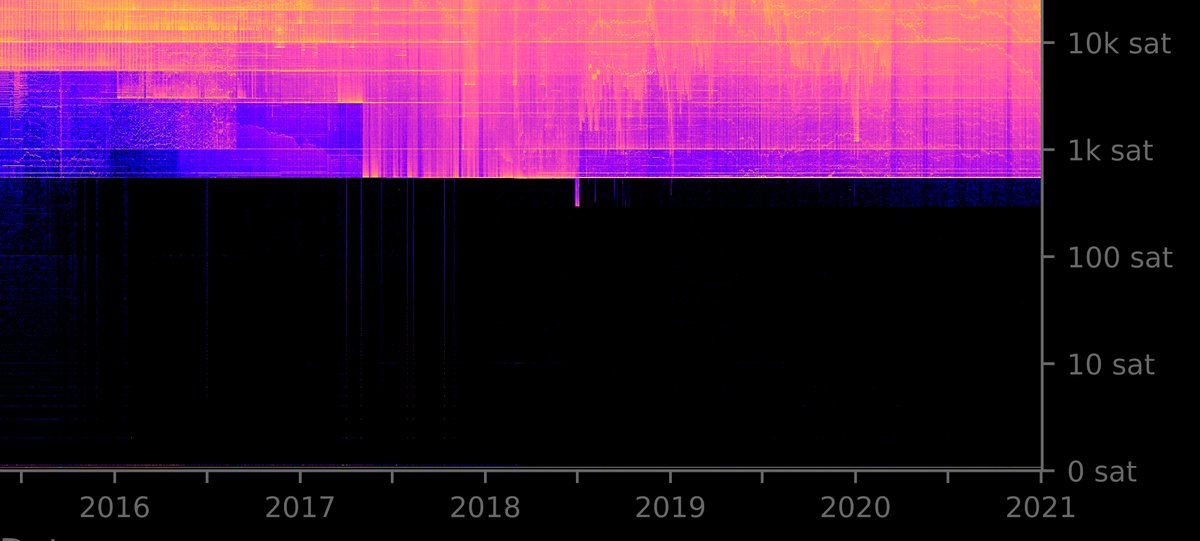
8\\ With some exceptions for miners and segwit users, the smallest possible on-chain transaction output (the dust limit) is 546 satoshis
Full resolution image: https://utxo.live/12_years_outputs.png
The figure is a 2D histogram rendered in python matplotlib with data pulled from my home node and organized into a custom database over several weeks
The figure is a 2D histogram rendered in python matplotlib with data pulled from my home node and organized into a custom database over several weeks

 Read on Twitter