German electricity 2020 (public grid):
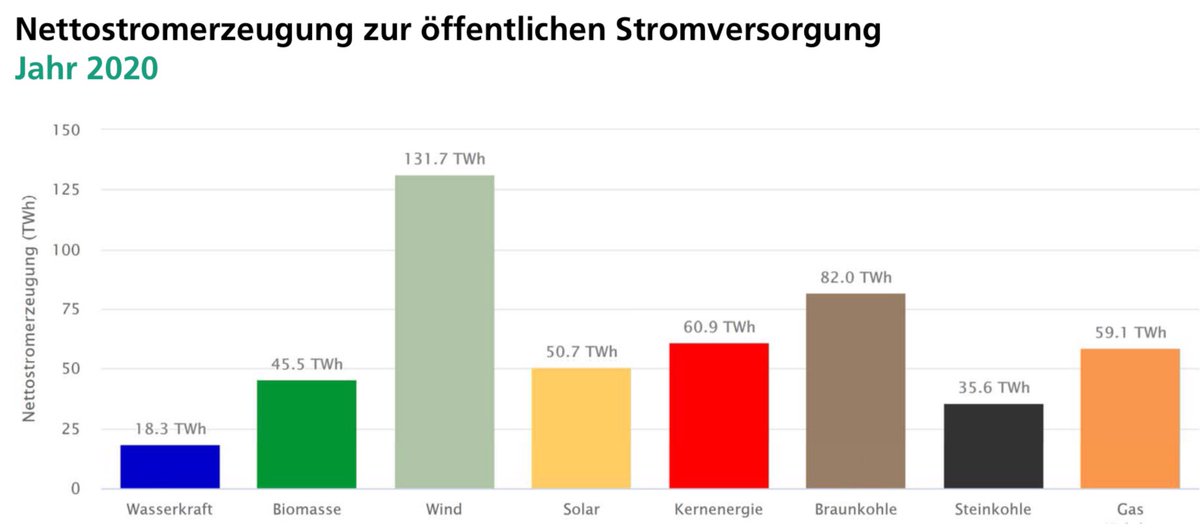
- Renewables at 50.5% (over 50% for the first time)
- Wind power produced more electricity than brown coal and hardcoal together
https://www.energy-charts.info/downloads/Stromerzeugung_2020_1.pdf
- Renewables at 50.5% (over 50% for the first time)
- Wind power produced more electricity than brown coal and hardcoal together
https://www.energy-charts.info/downloads/Stromerzeugung_2020_1.pdf
German electricity, 2010-2020:
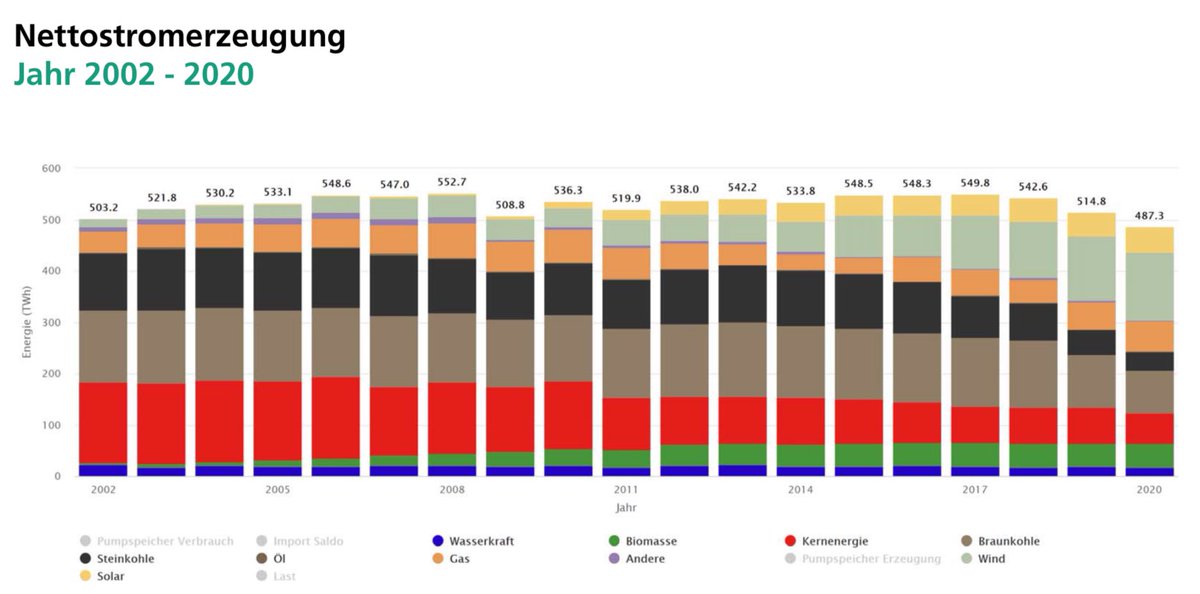
- Renewables sharply up, especially wind (light green)
- Coal (brown) down, accelerating
- Nuclear (red) down, nuclear exit in progress
- Renewables sharply up, especially wind (light green)
- Coal (brown) down, accelerating
- Nuclear (red) down, nuclear exit in progress
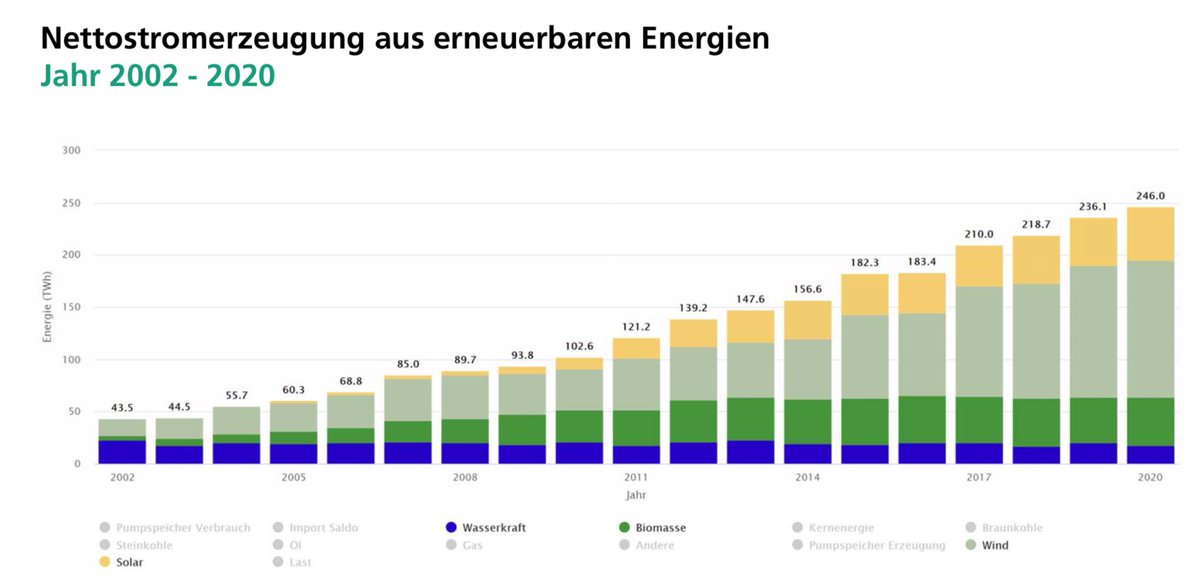
Germany, renewable electricity, public grid, production in TWh:
- Up by a factor of 6, between 2002 and 2020
- Doubled in the period 2011-2020
- Up by a factor of 6, between 2002 and 2020
- Doubled in the period 2011-2020
German electricity, public grid, just solar and wind versus all fossil electricity:
- Solar and wind produced more than brown coal + hardcoal + gas, for the first time, in 2020
- Solar and wind produced more than brown coal + hardcoal + gas, for the first time, in 2020
Capacity factors of German offshore wind farms, 2020:
- mostly between 35 and 45%
- highest: Sandbank, at 49.6%
- mostly between 35 and 45%
- highest: Sandbank, at 49.6%
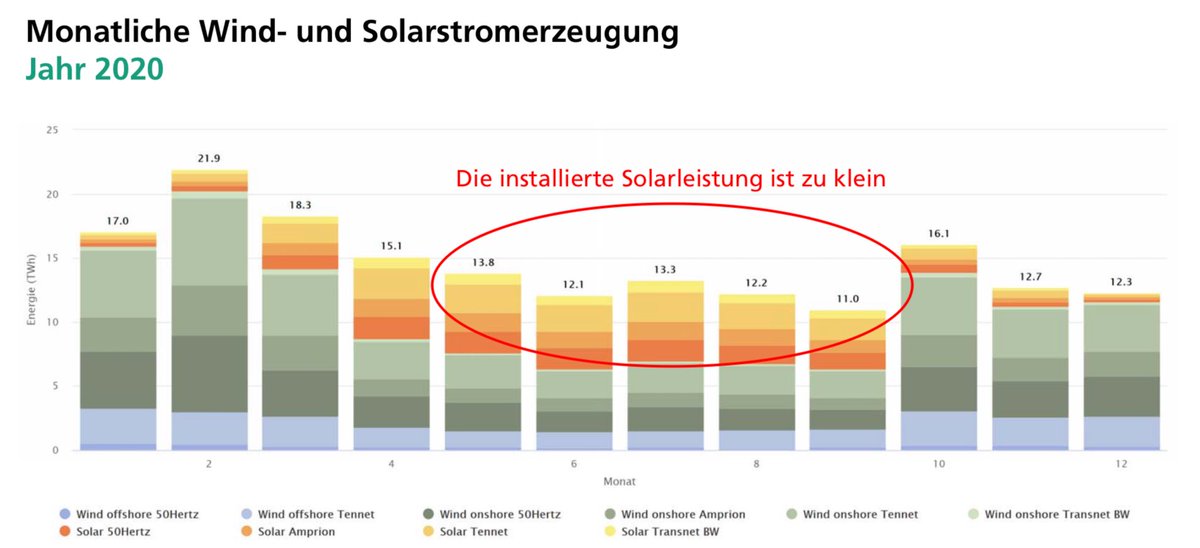
Germany 2020, wind and solar electricity per month, split by TSO region:
- Good complementarity: wind high in winter, solar in summer
- Conclusion Bruno @energy_charts: too little solar capacity; more would make the annual pattern flatter.
- Good complementarity: wind high in winter, solar in summer
- Conclusion Bruno @energy_charts: too little solar capacity; more would make the annual pattern flatter.
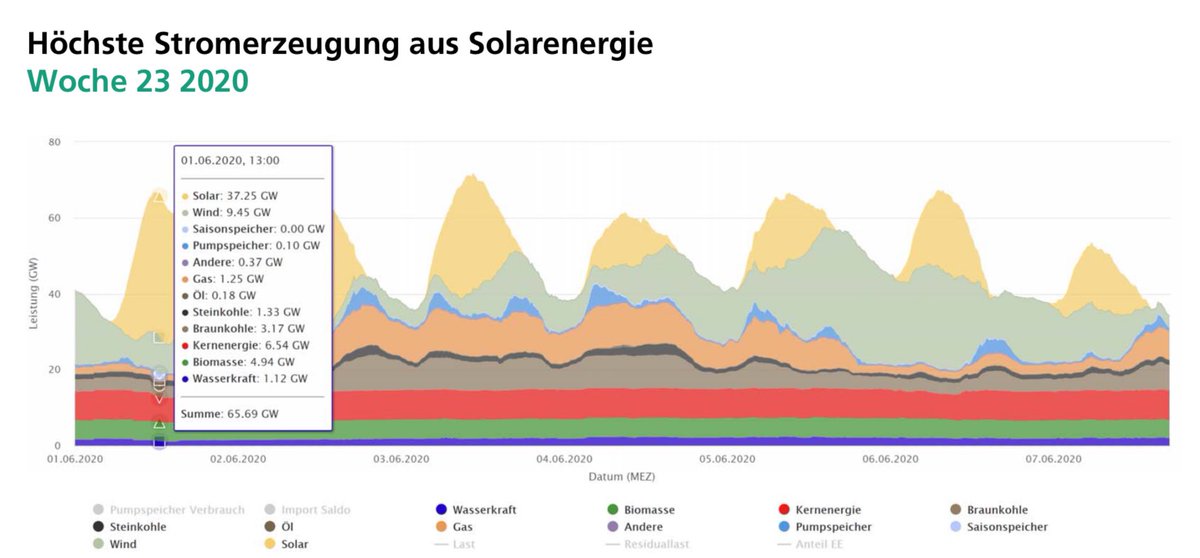
Highest solar PV production peak, Germany, 2020:
1 June, 13:00: 37.25 GW of solar PV power was 56% of total power generation.
Installed solar PV capacity was 51.0 GW, so this represented 73% of nominal power, due/thanks to different orientations and distributed locations.
1 June, 13:00: 37.25 GW of solar PV power was 56% of total power generation.
Installed solar PV capacity was 51.0 GW, so this represented 73% of nominal power, due/thanks to different orientations and distributed locations.
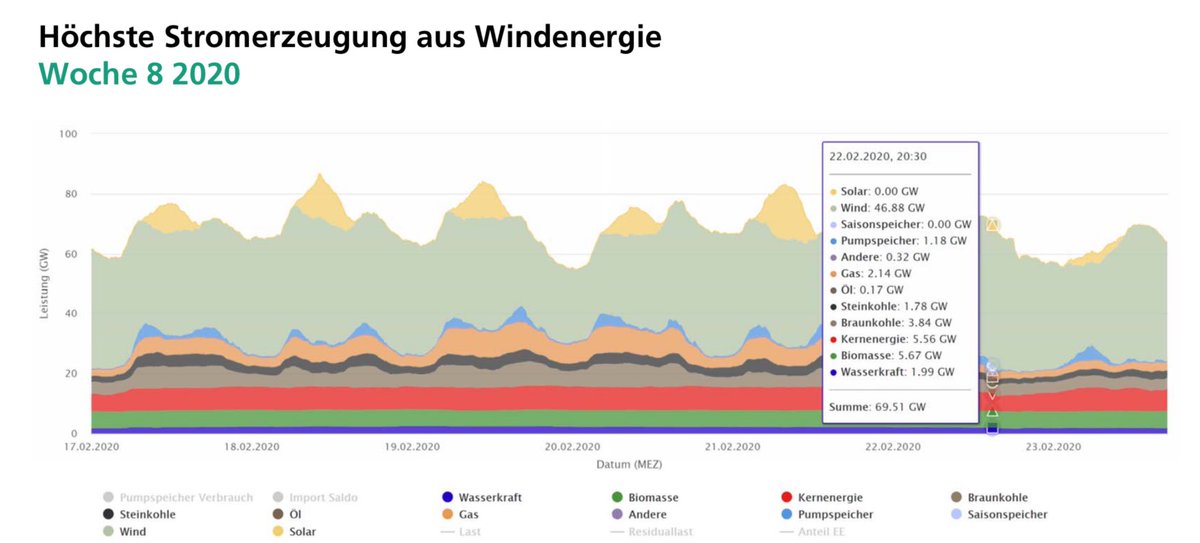
Highest wind power production peak, Germany, 2020:
22 February 20:30: 46.88 GW, which was 67% of all power generation at that time.
Installed wind capacity was 61.3 GW, so this represented 76.5% of nominal power, due/thanks to the distribution of wind farms over the country.
22 February 20:30: 46.88 GW, which was 67% of all power generation at that time.
Installed wind capacity was 61.3 GW, so this represented 76.5% of nominal power, due/thanks to the distribution of wind farms over the country.
Hours with negative wholesale electricity prices, Germany
- On the rise
- 298 hours in 2020, that’s 3.4% of the time
Happens when renewables + inflexible generation exceed demand. Together with hours of low prices, builds case for more storage, demand response, interconnection.
- On the rise
- 298 hours in 2020, that’s 3.4% of the time
Happens when renewables + inflexible generation exceed demand. Together with hours of low prices, builds case for more storage, demand response, interconnection.
Average wholesale electricity price (day ahead, €/MWh)), Germany, and EU CO2 price (€/tonne) 2002-2020.
Brown coal power plants emit 1 tCO2/MWh, so when the two bars meet, they get zero income for their power generation.
Brown coal power plants emit 1 tCO2/MWh, so when the two bars meet, they get zero income for their power generation.
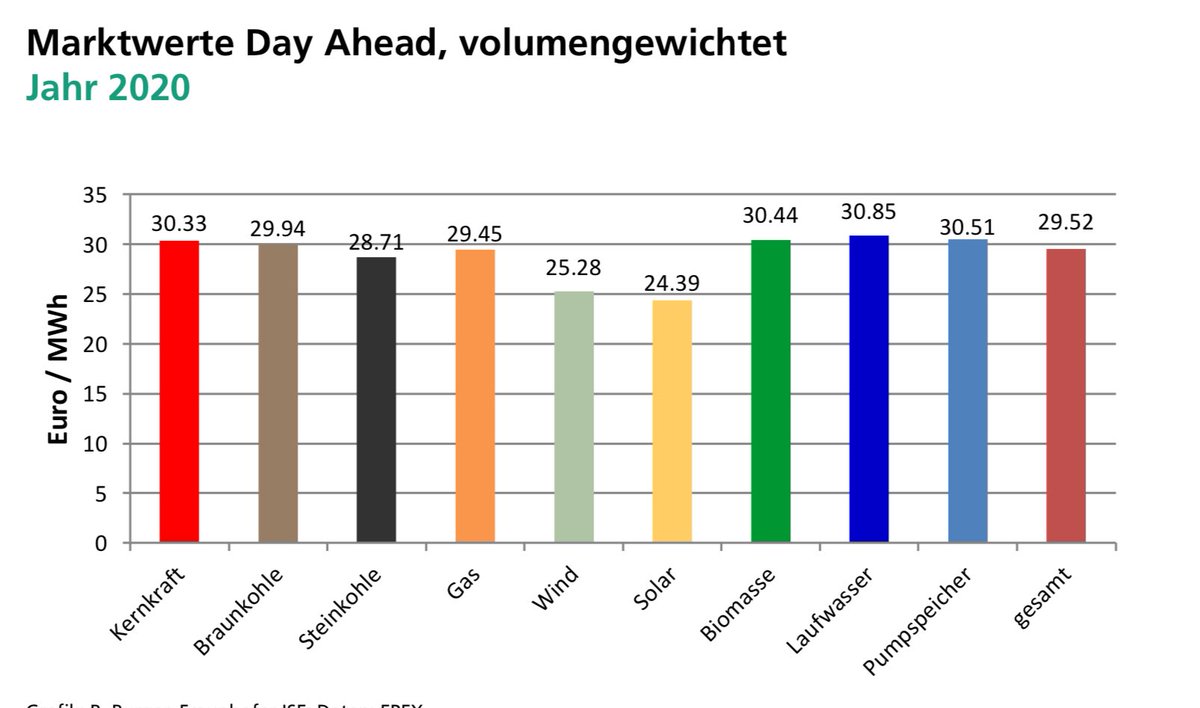
“Cannibalization”, German wind and solar, 2020.
When there’s lots of wind and sun, electricity prices go down. Which means that on average the prices that wind and solar electricity would get on the market are lower than for other sources: around -15%, in 2020.
When there’s lots of wind and sun, electricity prices go down. Which means that on average the prices that wind and solar electricity would get on the market are lower than for other sources: around -15%, in 2020.
Solar PV capacity installed per year, Germany, 2002-2020:
- Peaked in 2010-2012, at 7-8 GW/year
- Around 4 GW installed in 2020 (Jan-Nov)
- Total installed cpacity now: 53.6 GW
- Peaked in 2010-2012, at 7-8 GW/year
- Around 4 GW installed in 2020 (Jan-Nov)
- Total installed cpacity now: 53.6 GW
Onshore wind capacity installed per year, Germany, 2002-2020:
- peaked in 2014-2017, at 4-5 GW/year
- just over 1 GW installed in 2020 (Jan-Nov)
- total installed capacity now 54.6 GW
- peaked in 2014-2017, at 4-5 GW/year
- just over 1 GW installed in 2020 (Jan-Nov)
- total installed capacity now 54.6 GW
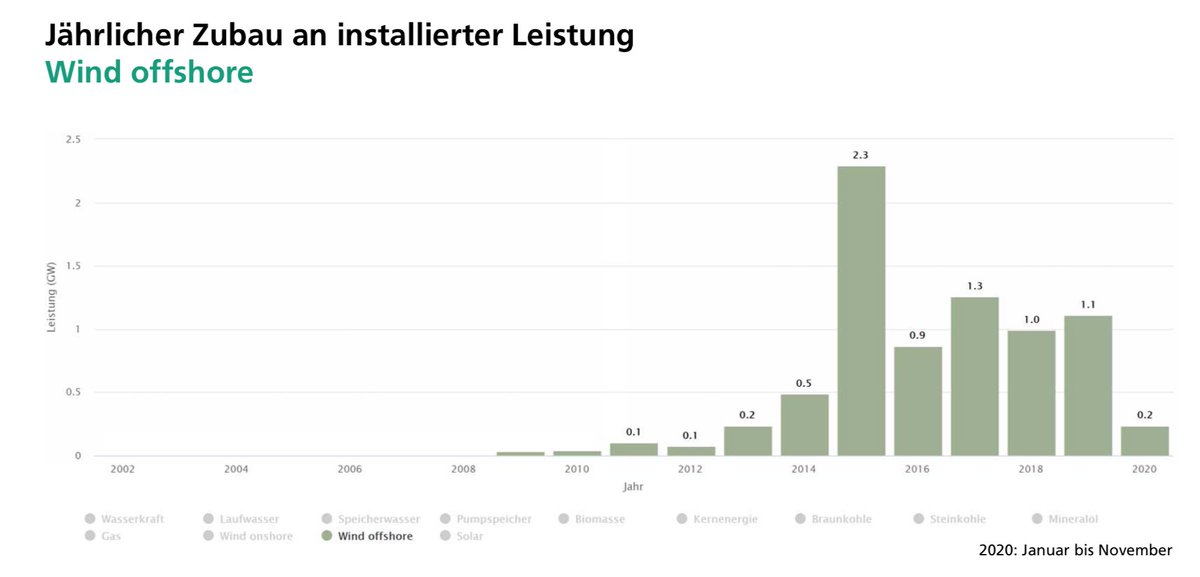
Offshore wind capacity installed per year, Germany, 2008-2020:
- peaked in 2015 (2.3 GW completed)
- only 0.2 GW completed in 2020
- total capacity now 7.7 GW
- massive expansion plans: 20 GW by 2030, 40 GW by 2040
- peaked in 2015 (2.3 GW completed)
- only 0.2 GW completed in 2020
- total capacity now 7.7 GW
- massive expansion plans: 20 GW by 2030, 40 GW by 2040
That completes this tour. Thanks prof. Bruno Burger ( @energy_charts) for providing this great set of data!
Full year 2020 overview: https://www.energy-charts.info/downloads/Stromerzeugung_2020_1.pdf (English translation may follow)
Graphs can be created on the realtime site: https://www.energy-charts.info/index.html?l=en&c=DE (in English)
Full year 2020 overview: https://www.energy-charts.info/downloads/Stromerzeugung_2020_1.pdf (English translation may follow)
Graphs can be created on the realtime site: https://www.energy-charts.info/index.html?l=en&c=DE (in English)
PS As a result of this development, CO2 emissions per kWh of electricity on the German public grid are of course going down. This graph for 1990-2019 shows almost 50% reduction. 2020 will be better again; have asked @energy_charts for his estimate.
https://de.statista.com/statistik/daten/studie/38897/umfrage/co2-emissionsfaktor-fuer-den-strommix-in-deutschland-seit-1990/
https://de.statista.com/statistik/daten/studie/38897/umfrage/co2-emissionsfaktor-fuer-den-strommix-in-deutschland-seit-1990/

 Read on Twitter