Over the course of the next few days I'll be sharing a bit of info on the different financial ratios/multiples/variables that are used to support a person's decision to invest in a company or not.
First, a quick review of financial statements. https://twitter.com/guruintraining_/status/1169373148539695109?s=19
Generally you have profitability, liquidity, and solvency ratios.
Profitability ratios look at how well a business generates income relative to the their sales/revenues. Mostly calculated from the income statement.
Higher the better yeah.
See examples
Profitability ratios look at how well a business generates income relative to the their sales/revenues. Mostly calculated from the income statement.
Higher the better yeah.
See examples

Liquidity ratios look at a company's ability to cover it's debt obligations over the next 12 months or less with assets that are relatively easy to sell. These #s come from the balance sheet.
Higher the better.....sometimes
Examples
Higher the better.....sometimes
Examples

Solvency ratios look at the ability of a company to meet it's debt obligations that go beyond 12 months (includes all debt really- long and short).
Lower the better generally.
Lower the better generally.
Valuation multiples show a company's productivity, efficiency and gives us a way to compare like company's to decide where to invest.
These take a bit more analysis to interpret.
Example
These take a bit more analysis to interpret.
Example

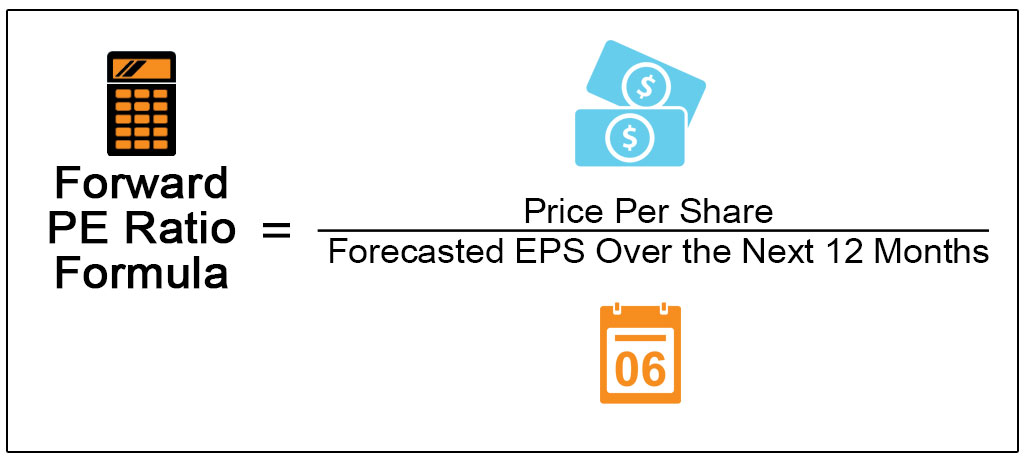
The Forward PE ratio
This is an update to the normal or trailing PE ratio that we use. The issue with the normal PE is that it is backward looking. It looks at a earnings that have already been made. It doesn't speak much to potential earnings in the future.
This is an update to the normal or trailing PE ratio that we use. The issue with the normal PE is that it is backward looking. It looks at a earnings that have already been made. It doesn't speak much to potential earnings in the future.
So a company's stock can have a high trailing PE but a low forward PE. This would mean that at the current price earnings from the last 12 months was low compared to the growth in earnings that is expected next year.
What if the trailing PE is low but the forward PE is high?
What if the trailing PE is low but the forward PE is high?

Thing is, investors should invest based on future earnings power, not the past because what happens in the past doesn't have to repeat in the future.
The issue with the forward PE is that it is subjective and is subject to greater error and bias.
Overall, using both is ideal.
The issue with the forward PE is that it is subjective and is subject to greater error and bias.
Overall, using both is ideal.
The PEG ratio
This updates the normal PE ratio that we use. That normal PE ratio is hard to compare across firms at different levels of growth. Mature companies will trade at a lower PE while higher growth companies that are expanding rapidly trade at a higher PE.
This updates the normal PE ratio that we use. That normal PE ratio is hard to compare across firms at different levels of growth. Mature companies will trade at a lower PE while higher growth companies that are expanding rapidly trade at a higher PE.
The PEG ratio adjusts the PE ratio for the level of growth that we expect in the company and makes it much easier to compare. So if the PE is 10 and the company is expected to grow by 10% the PEG becomes 1.
At a growth rate of 5% the PEG is 2. The lower the PEG the better.
At a growth rate of 5% the PEG is 2. The lower the PEG the better.

 Read on Twitter


