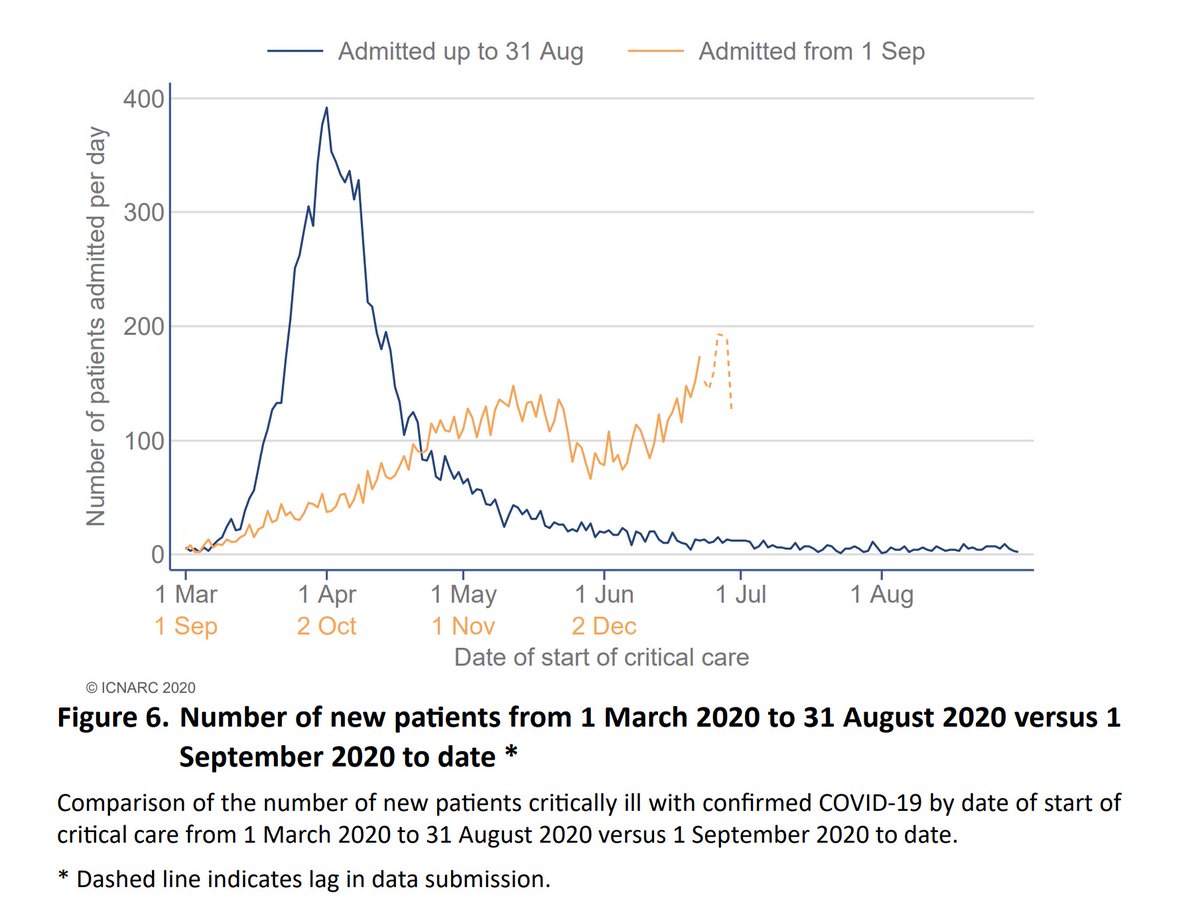
The latest @ICNARC update on ICU activity was published yesterday, and is summarised here on behalf of @COVID19actuary. Focussing on patient numbers (as outcomes are little changed), there's a clear upswing in admissions in the south east of the country, particularly London. 1/12
Five areas have now surpassed their first wave total and in total the figure is now at 93% of the first wave and will be exceeded in the next week at current rates of admission. 2/12
A visual representation of how the second wave has been more spread than the first, and also how the numbers are rising again after falling during the second half of November. The current gradient looks steeper than anything seen to date in this wave. 3/12
This next slide shows activity in relation to population size. You can see how London and the East are reaching admission levels not seen since the peak of the first wave (not that that should be seen as the only benchmark of success or failure), and are still rising. 4/12
Numbers in ICU are also rising again, although are still well below the peak. The upward trajectory is particularly concerning in London, currently appearing nearly as steep as in late March. 5/12
We don't have Dec's figures yet, but we can expect the orange bar to be even higher given the figures above. But why are non-elective non-COVID patients so much lower? The next graphs give some insight. 6/12
Admissions due to heart conditions are well down, as are strokes, although the latter is less marked. A better understanding of what is causing this reduction would be of interest - to a layperson it's not obvious that there would be any misclassification at admission. 7/12
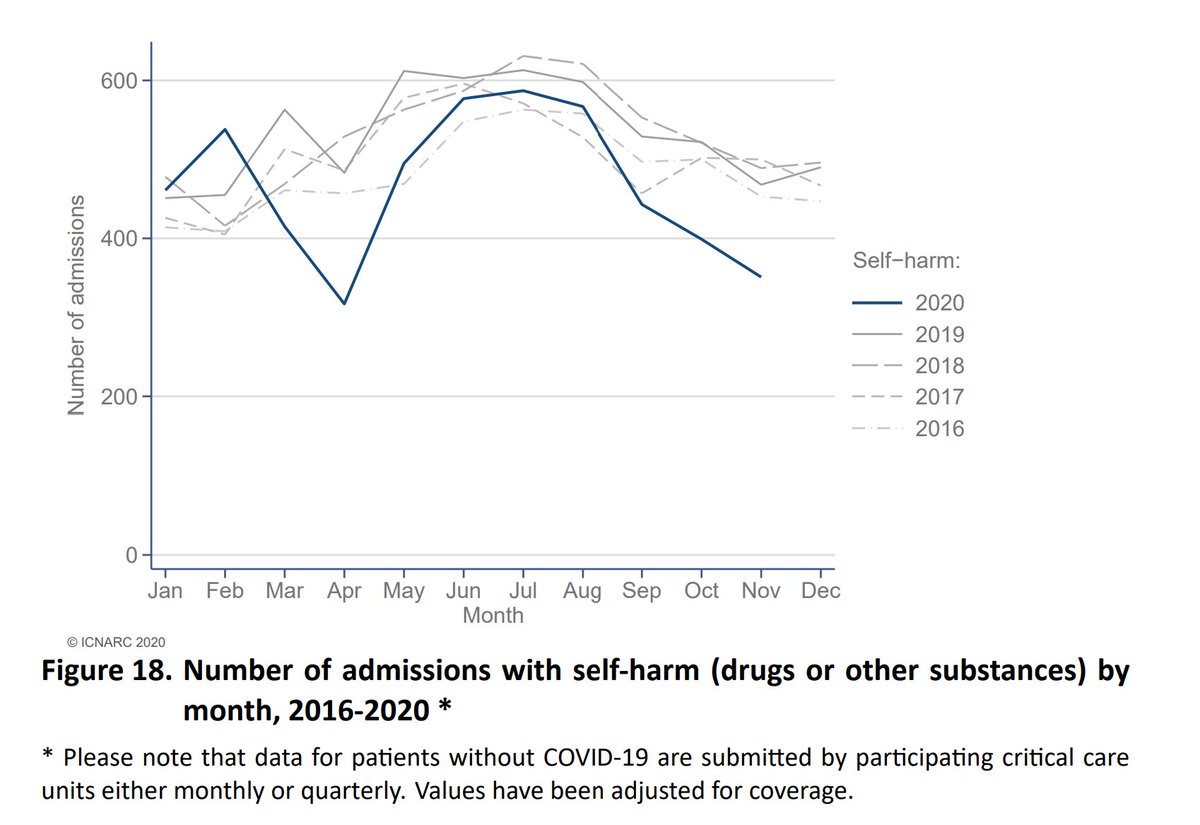
There's also a big reduction in trauma and self harm. Less activity, particularly of the elderly, might explain the former - the latter certainly doesn't support the increase in mental health related incidents that some have hypothesised. 8/12
We can see here that although pneumonia admissions are reduced, COVID activity is over double the expected for pneumonia. The unusually high 400 flu admissions we saw in Dec 19 is a tenth that for COVID this year, so these admissions can't simply be flu "re-badged". 9/12
Over 40% of admissions are under 60. Although this isn't representative of overall hospital admissions, it means over 4,000 of working age have required intensive treatment during the second wave. COVID is not just for the elderly (not that they are any less important). 10/12
Finally, two slides on outcomes. Over 3,000 who required ICU treatment have already sadly succumbed to the illness, around 30%. But with many still being treated, the overall survival rate is less favourable than that, with 37% dying within 28 days. 11/12
Worth noting that ICU represents a small part of overall hospital activity. Around 85% of COVID deaths are not of ICU patients. Our support and gratitude should be to all health service staff working under very difficult conditions as we mark the new year. Thank you all! 12/12

 Read on Twitter


