Market structure 101 :
1#
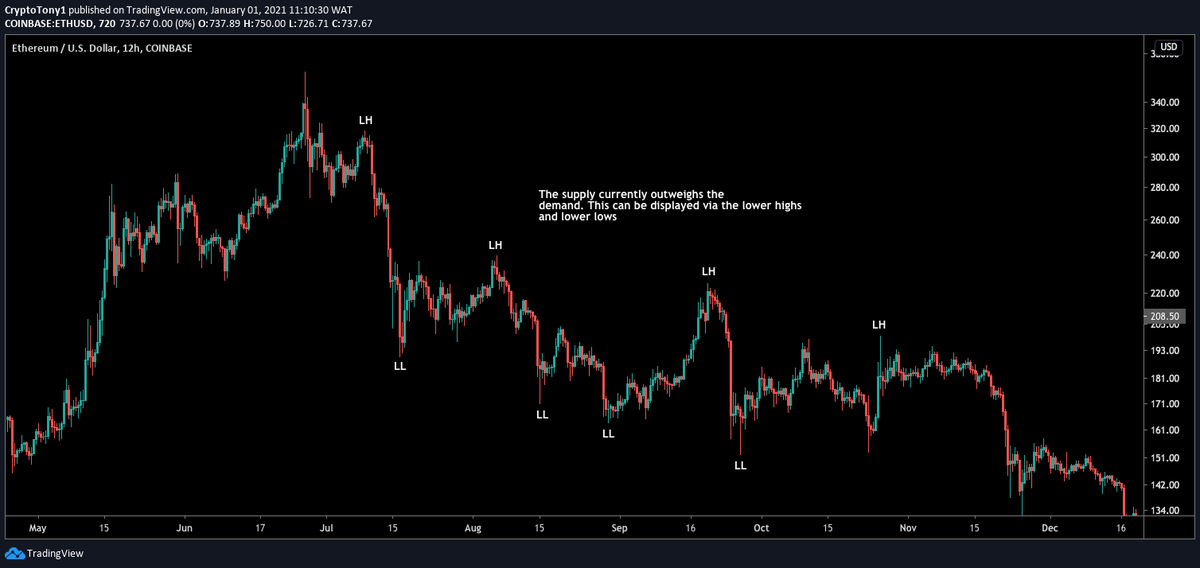
So when you first look at a chart you want to determine whether the asset is Bearish or Bullish. Having this edge can help you determine whether the edge is to short or to long an asset, or whether to steer clear if you simply want to buy and hold
1#
So when you first look at a chart you want to determine whether the asset is Bearish or Bullish. Having this edge can help you determine whether the edge is to short or to long an asset, or whether to steer clear if you simply want to buy and hold
2#
To demonstrate how to determine this i am using the 12 hour #Ethereum vs the $USD chart. Now you can apply this method to any TF depending on if your swing trading (Higher time frames) or Scalp trading (Lower time frames.
To demonstrate how to determine this i am using the 12 hour #Ethereum vs the $USD chart. Now you can apply this method to any TF depending on if your swing trading (Higher time frames) or Scalp trading (Lower time frames.
3#
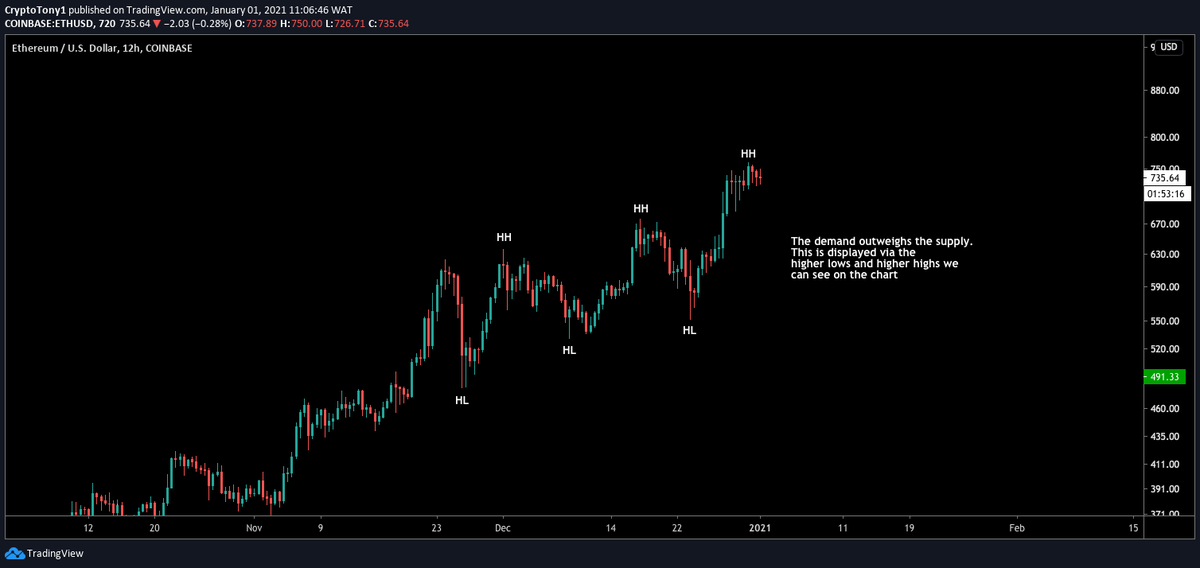
So let us take a look at a bullish market structure. Now when an asset is bullish ( Buyers in control) you want to see that the demand outweighs the supply
This is evident by a series of higher lows and higher highs. Here you can see this demonstrated perfectly
So let us take a look at a bullish market structure. Now when an asset is bullish ( Buyers in control) you want to see that the demand outweighs the supply
This is evident by a series of higher lows and higher highs. Here you can see this demonstrated perfectly

 Read on Twitter


